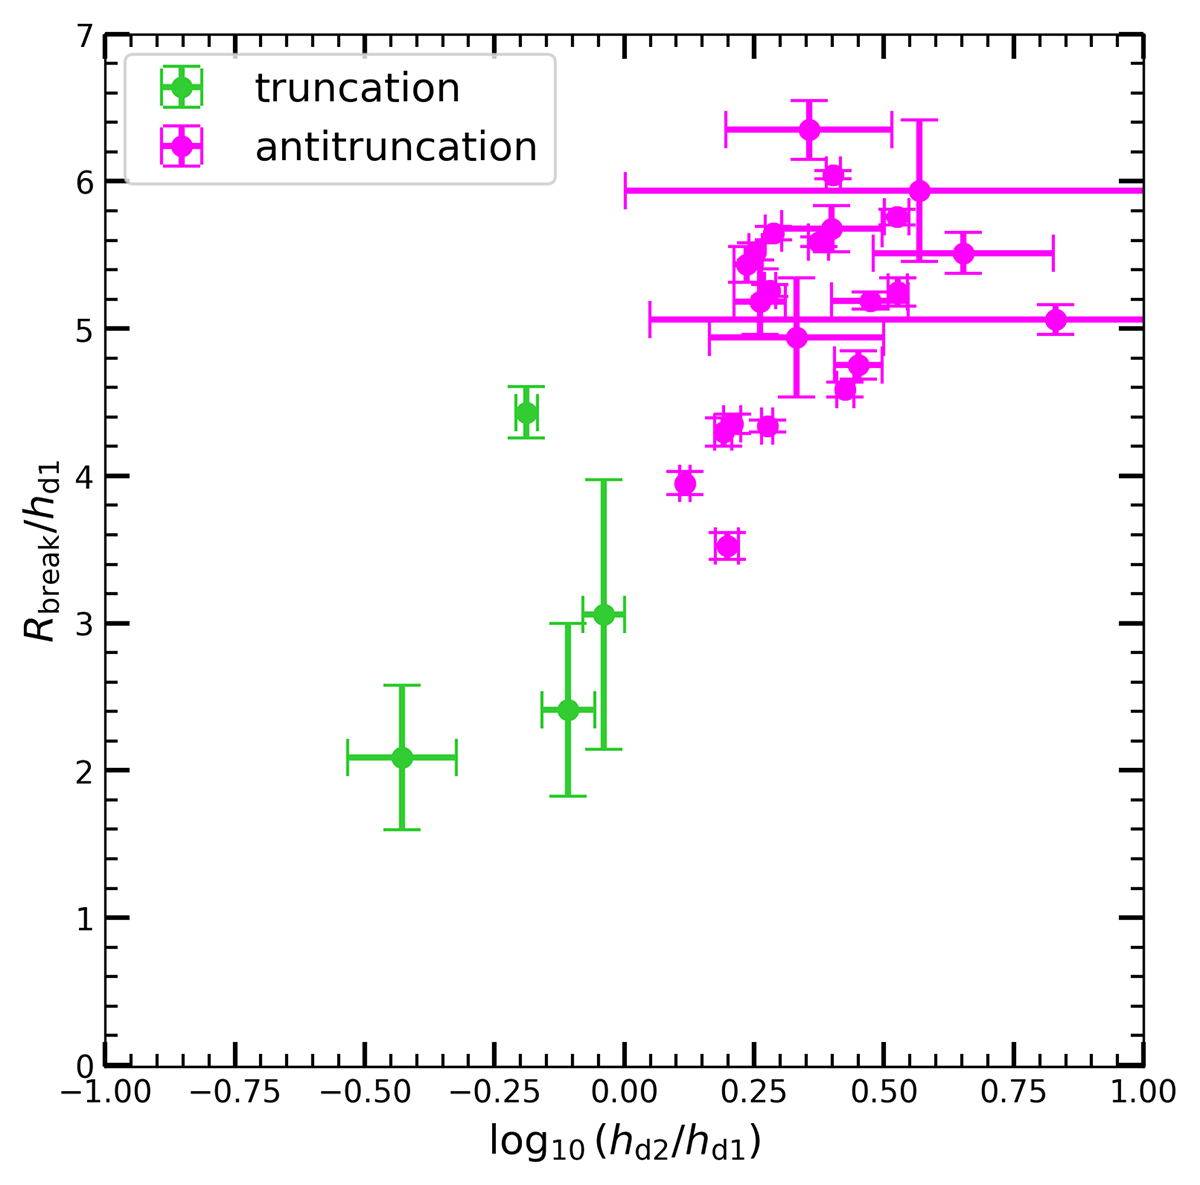
Fig. 9.
Download original image
Ratio of the truncation radius to the first disc scalelength (Rbreak/hd1) as a function of the logarithm of the ratio between the disc scalelengths (hd1/hd2). This plot visually separates Type II galaxies (green dots) from Type III galaxies (magenta dots). The error bars are directly extracted from the uncertainties on the parameters obtained during the surface brightness profile fitting process.
Current usage metrics show cumulative count of Article Views (full-text article views including HTML views, PDF and ePub downloads, according to the available data) and Abstracts Views on Vision4Press platform.
Data correspond to usage on the plateform after 2015. The current usage metrics is available 48-96 hours after online publication and is updated daily on week days.
Initial download of the metrics may take a while.