Fig. 14.
Download original image
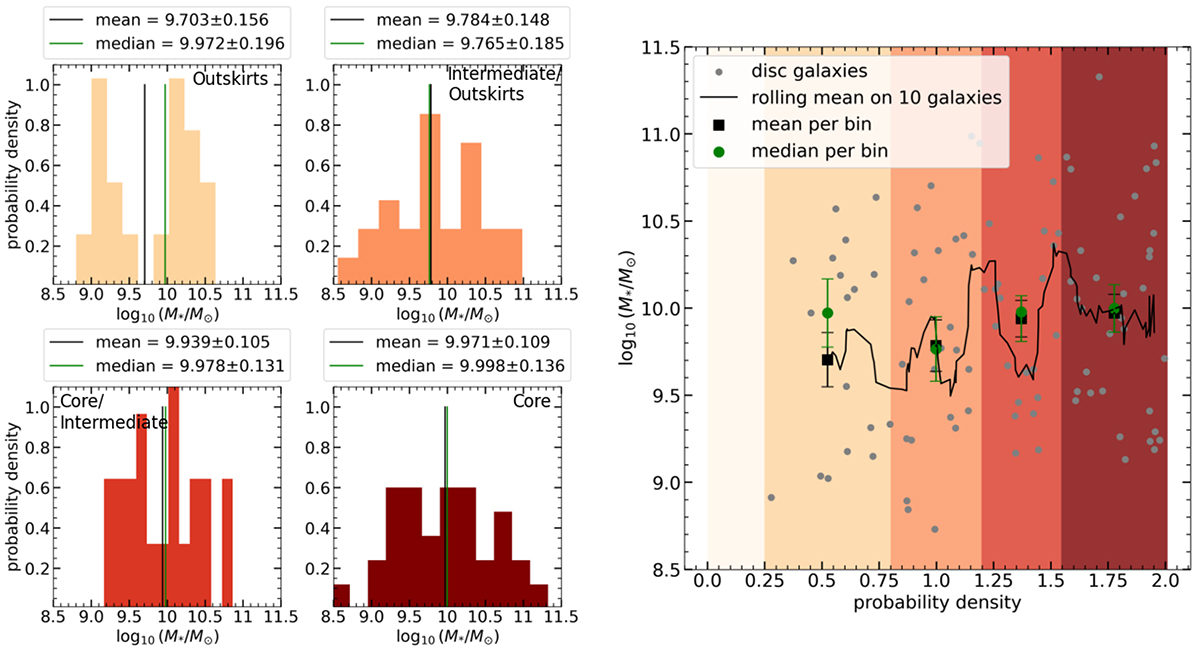
Stellar mass distribution of galaxies according to their position in the cluster. Left-hand panel: stellar mass distribution of galaxies across the different environments (from outskirts – top left panel – to core – bottom right panel), each represented by a different colour as labelled. Right-hand panel: galaxy mass as a function of probability density, with individual galaxies represented by grey dots. The black curve indicates the rolling average over 10 galaxies, black squares show the mean, and green dots represent the median for each density bin. The error bars corresponds to the standard error on the mean and median.
Current usage metrics show cumulative count of Article Views (full-text article views including HTML views, PDF and ePub downloads, according to the available data) and Abstracts Views on Vision4Press platform.
Data correspond to usage on the plateform after 2015. The current usage metrics is available 48-96 hours after online publication and is updated daily on week days.
Initial download of the metrics may take a while.