Fig. 13.
Download original image
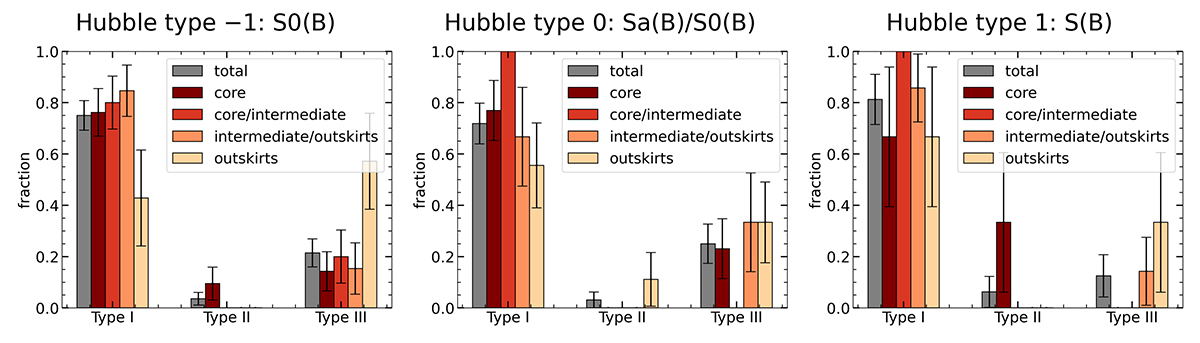
Fraction of each profile type (I, II, III) according to the angular projection within the cluster (from red to yellow) similar to Fig. 11 but for different galaxy morphology from Hubble type −1 on the left-hand panel, to one on the right-hand panel. Error bars represent the 1σ binomial uncertainties calculated as ![]() , where f is the measured fraction and N is the total number of galaxies in the corresponding bin.
, where f is the measured fraction and N is the total number of galaxies in the corresponding bin.
Current usage metrics show cumulative count of Article Views (full-text article views including HTML views, PDF and ePub downloads, according to the available data) and Abstracts Views on Vision4Press platform.
Data correspond to usage on the plateform after 2015. The current usage metrics is available 48-96 hours after online publication and is updated daily on week days.
Initial download of the metrics may take a while.