Fig. 8
Download original image
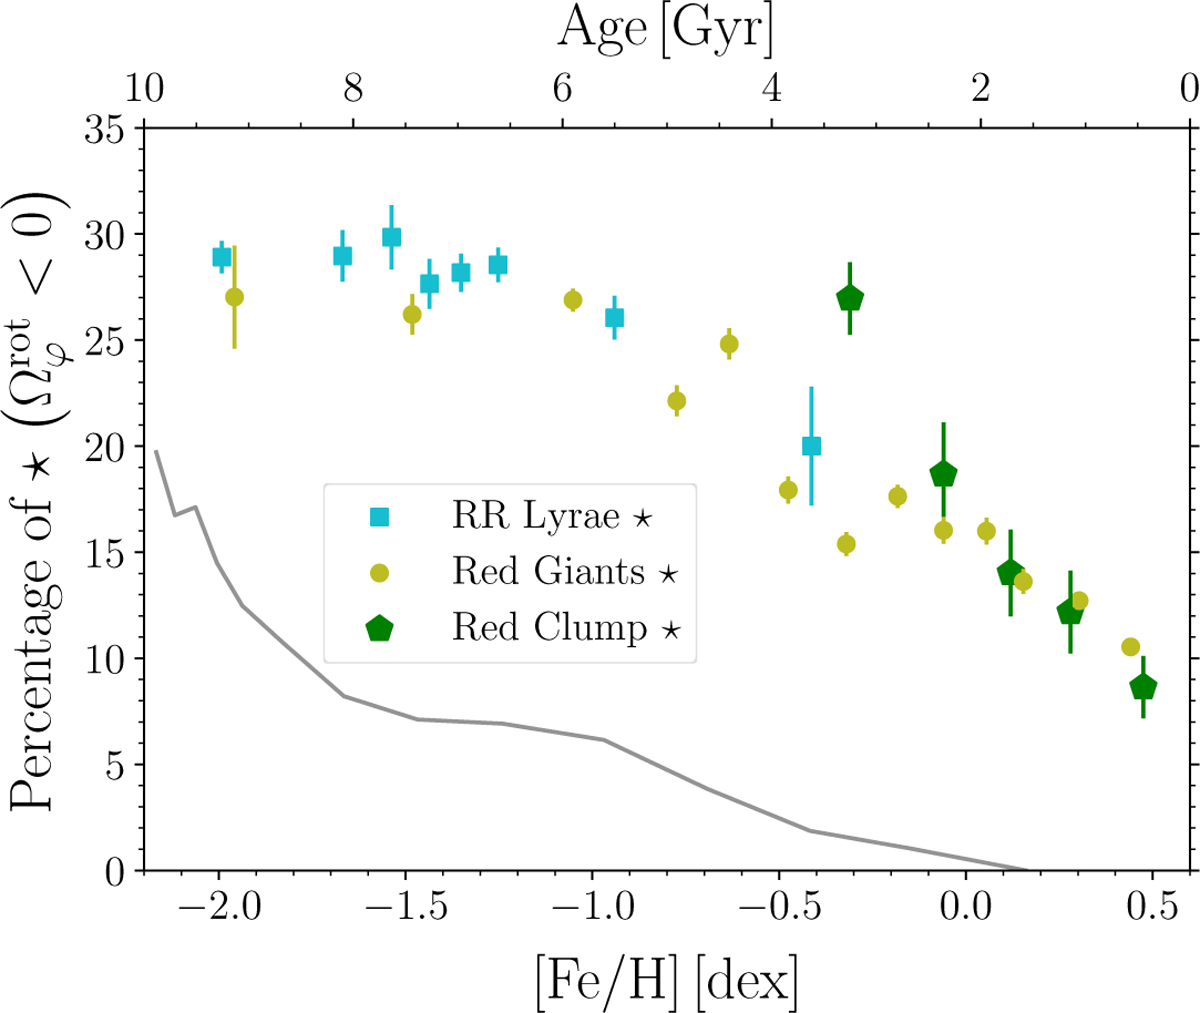
Chemical and orbital properties for the RR Lyrae variable, BDBS red clump star, and APOGEE red giant datasets together with the results from the simulation. The figure shows the dependence of the percentage of retrograde stars as a function of their [Fe/H]. The light blue squares represent metallicity bins for the RR Lyrae sample. The green pentagons and yellow circles represent BDBS stars and APOGEE red giants, respectively. The gray line denotes a fraction of retrograde (negative ![]() ) stellar particles in the simulation as a function of age (upper axis).
) stellar particles in the simulation as a function of age (upper axis).
Current usage metrics show cumulative count of Article Views (full-text article views including HTML views, PDF and ePub downloads, according to the available data) and Abstracts Views on Vision4Press platform.
Data correspond to usage on the plateform after 2015. The current usage metrics is available 48-96 hours after online publication and is updated daily on week days.
Initial download of the metrics may take a while.