Fig. 7
Download original image
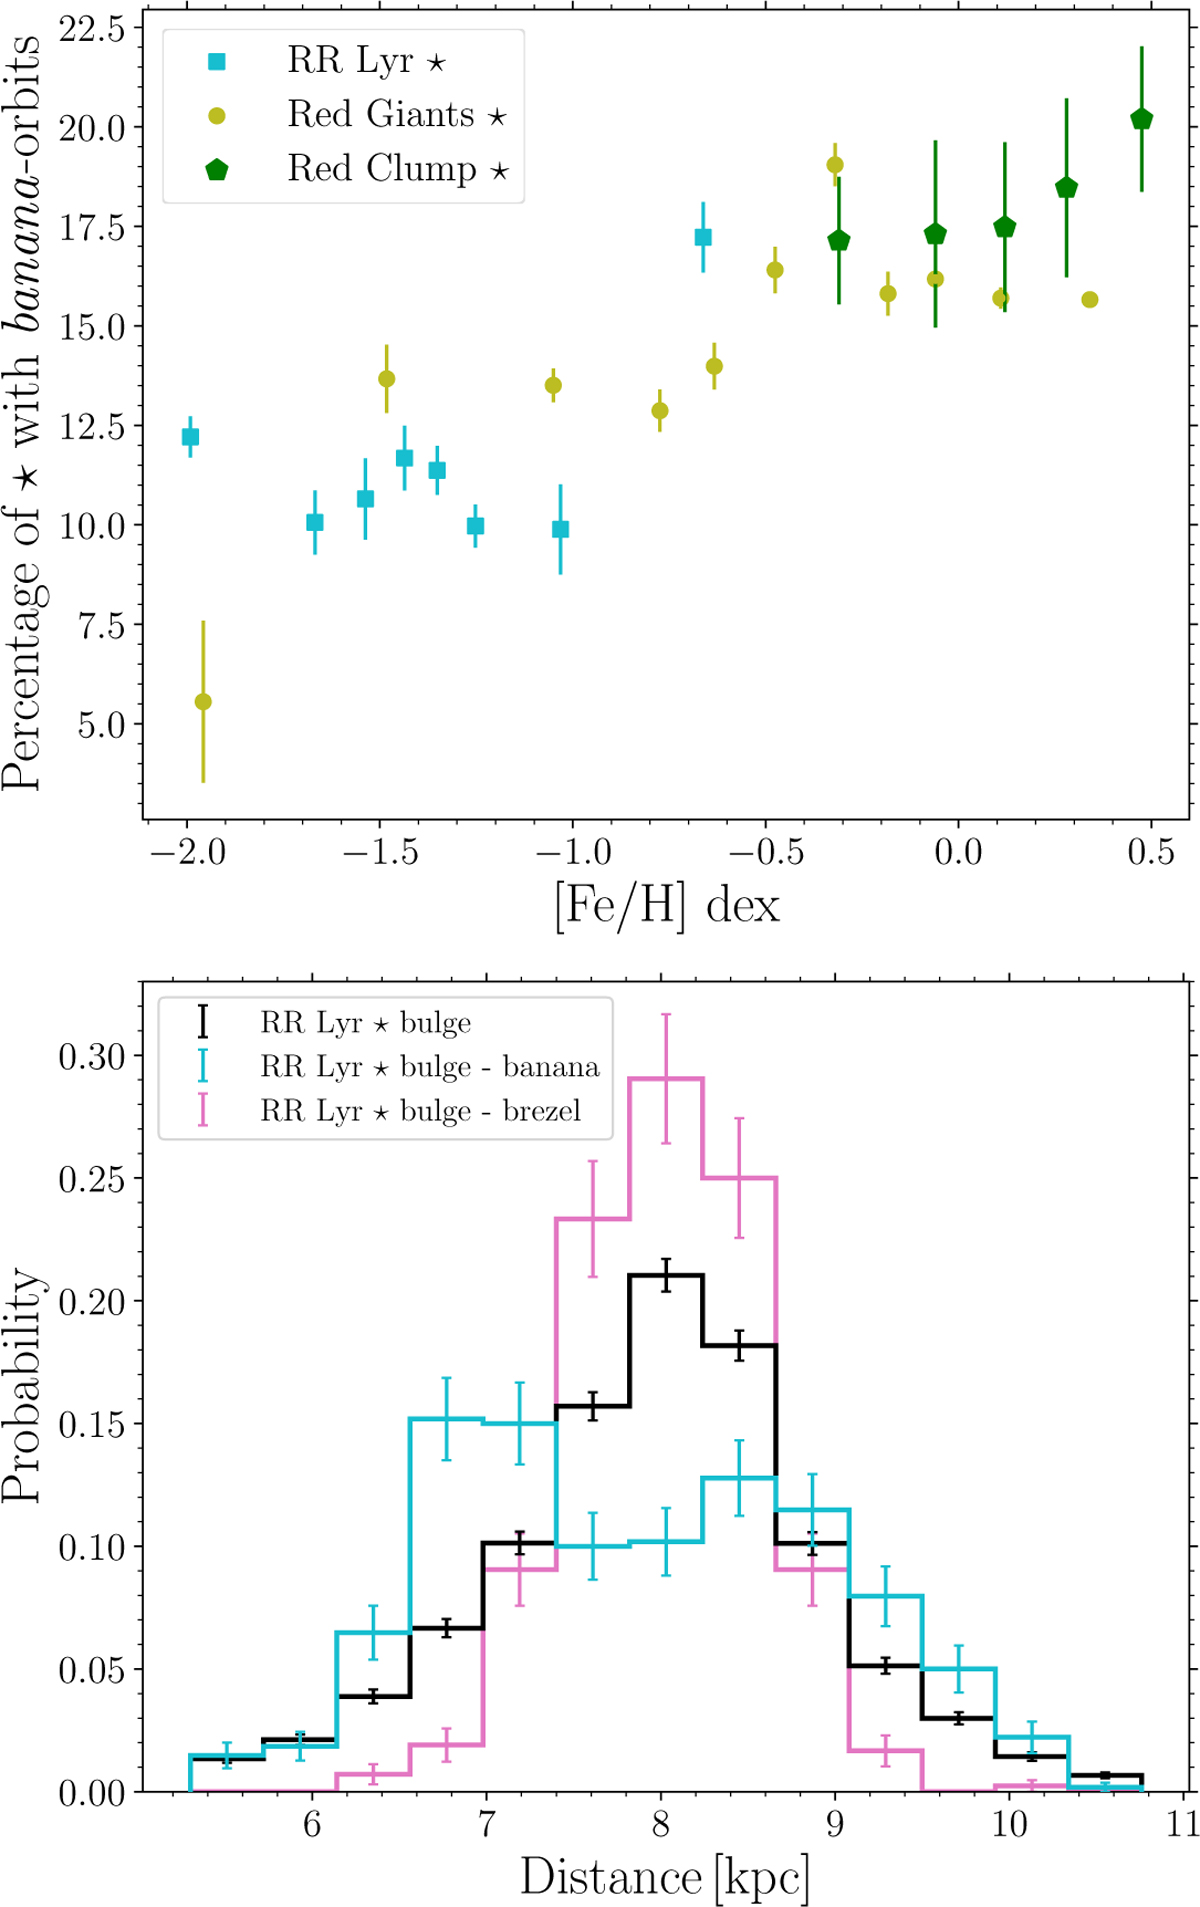
Fraction of banana-orbits on metallicity for the APOGEE red giant (top, yellow circles), BDBS red clump (green pentagons), and RR Lyrae (blue squares) datasets. The bottom panel shows the distance distribution of the RR Lyrae dataset. The black histogram denotes the distances of the bulge RR Lyrae while the blue histogram shows the double-peaked distribution for RR Lyrae stars with banana orbits. The pink histogram shows the RR Lyrae with brezel-orbits which also has a single peak distribution. The uncertainties on individual bins (top panel) were estimated by varying the [Fe/H] by its errors and estimating the fraction of banana orbits in each iteration. For the bottom panel, the uncertainties on each bin represent the Poisson noise.
Current usage metrics show cumulative count of Article Views (full-text article views including HTML views, PDF and ePub downloads, according to the available data) and Abstracts Views on Vision4Press platform.
Data correspond to usage on the plateform after 2015. The current usage metrics is available 48-96 hours after online publication and is updated daily on week days.
Initial download of the metrics may take a while.