Fig. 5
Download original image
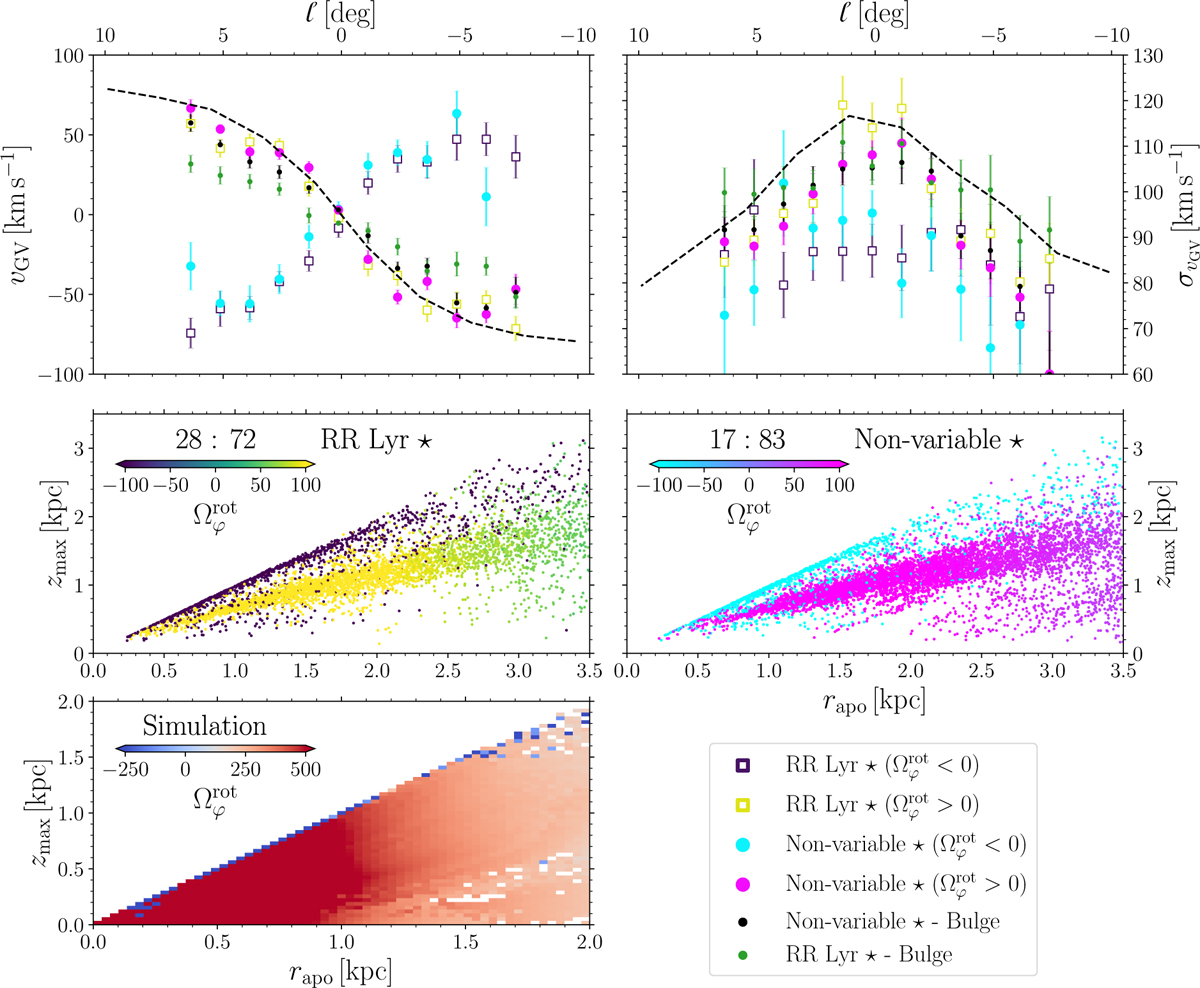
Kinematic and orbital properties for RR Lyrae variables, nonvariable giants, and stellar particles from the simulation. The top panels show the distribution of average vGV and its dispersion σvGV across the Galactic longitude bins. The middle and bottom panels display the distribution of orbital properties zmax vs. rapo for RR Lyrae (middle left panel), nonvariable giants (middle right panel), and model HG1 (bottom left panel, at 10 Gyr). The color-coding in all panels is based on ![]() . The black dashed lines in the top panels represent the rotation and dispersion curve based on the bar model Shen et al. (2010) for b = 4 deg.
. The black dashed lines in the top panels represent the rotation and dispersion curve based on the bar model Shen et al. (2010) for b = 4 deg.
Current usage metrics show cumulative count of Article Views (full-text article views including HTML views, PDF and ePub downloads, according to the available data) and Abstracts Views on Vision4Press platform.
Data correspond to usage on the plateform after 2015. The current usage metrics is available 48-96 hours after online publication and is updated daily on week days.
Initial download of the metrics may take a while.