Fig. 4
Download original image
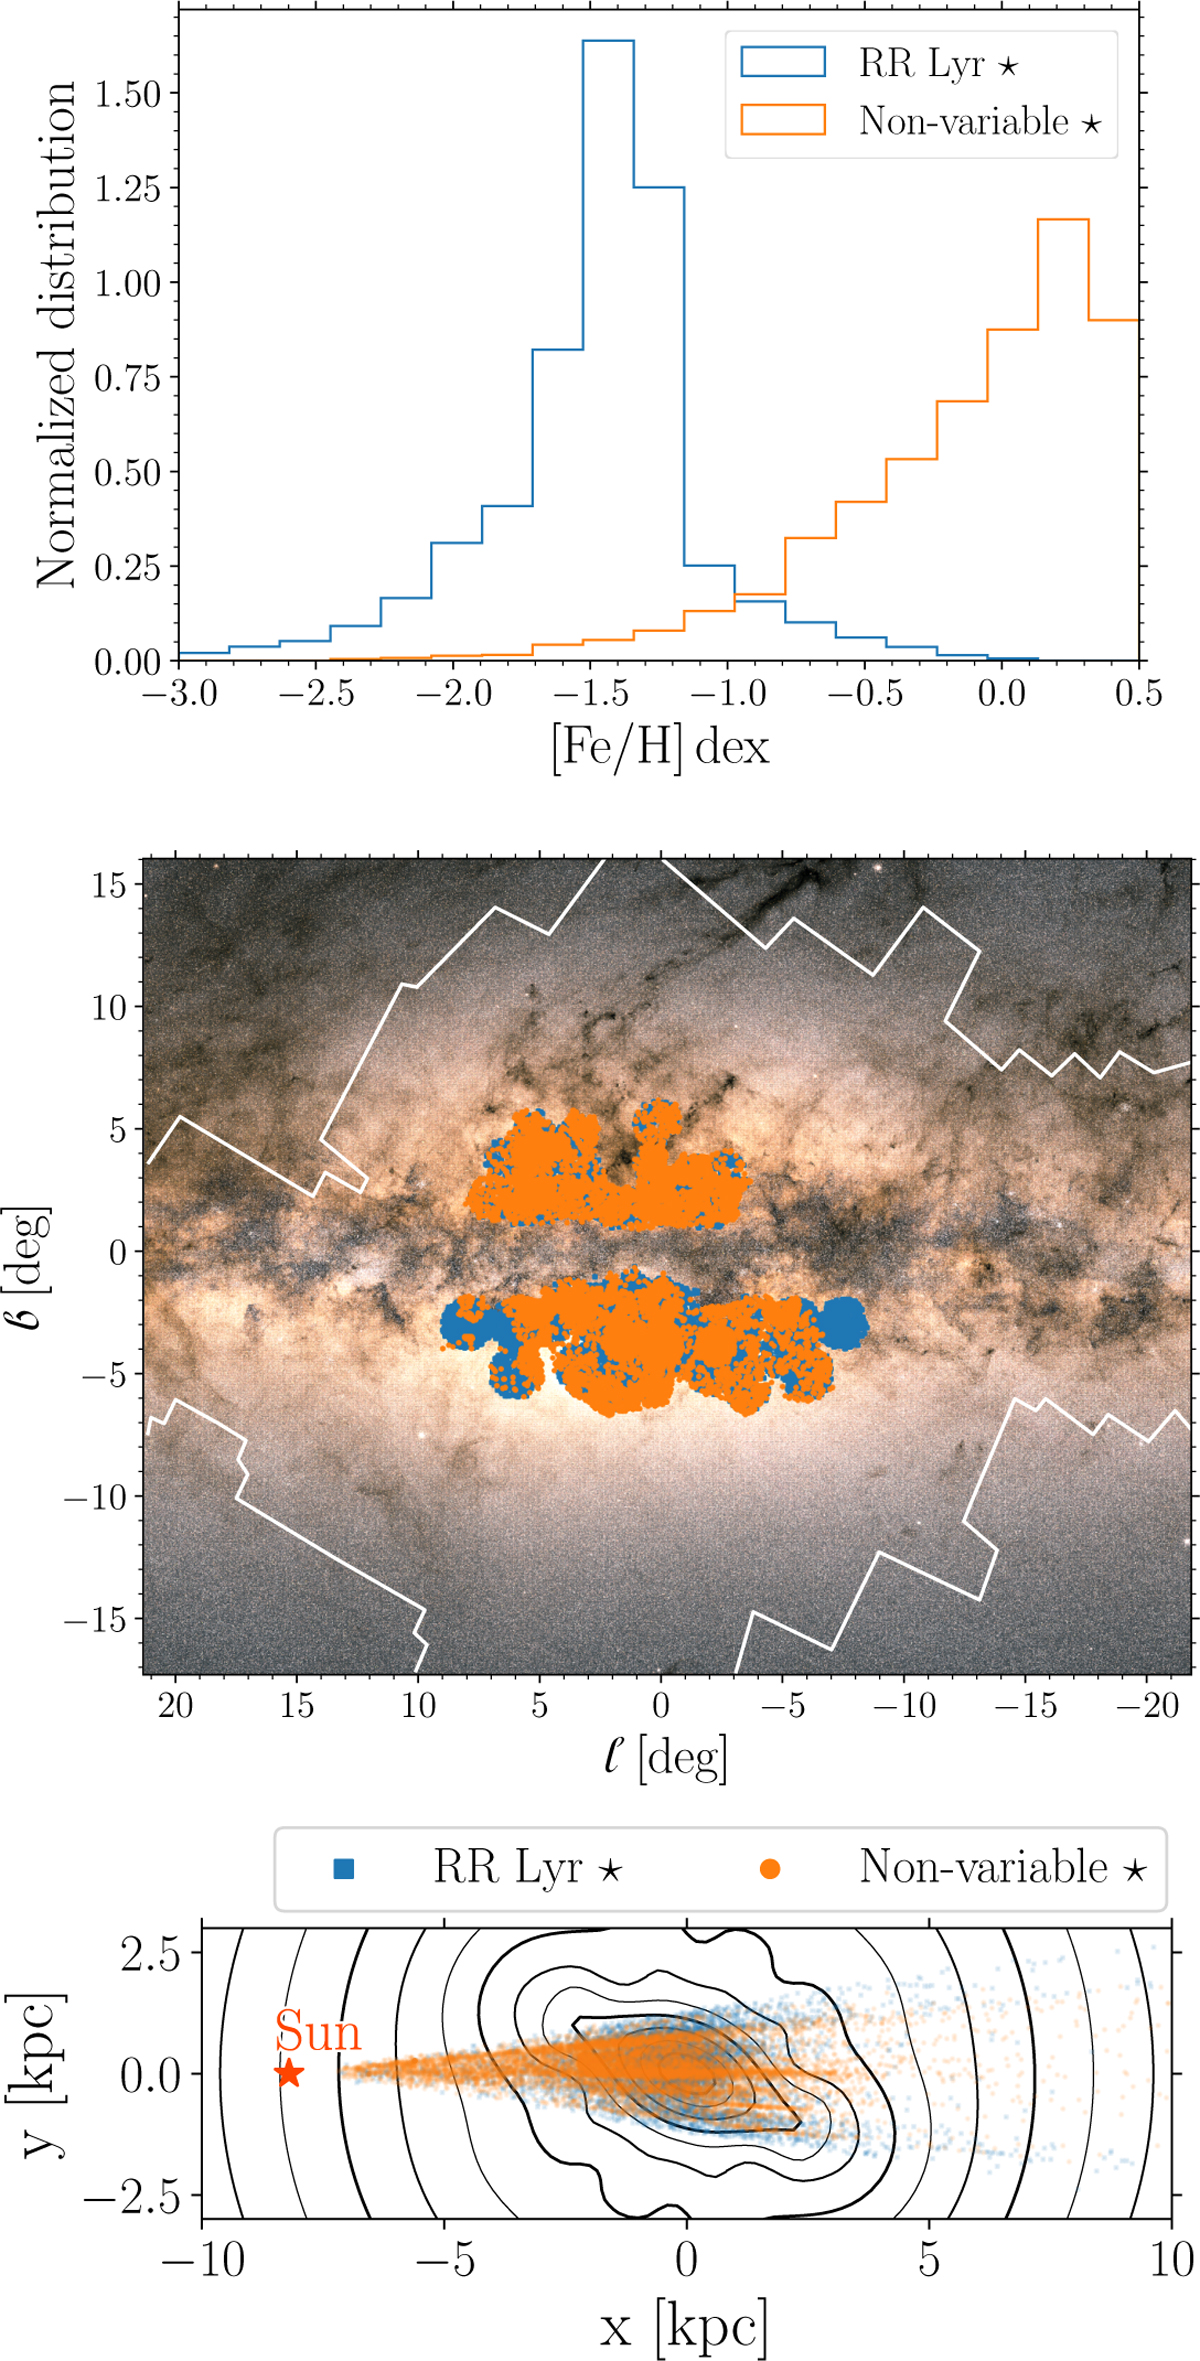
Metallicity (top panel) and spatial distribution in Galactic coordinates (middle panel) and Cartesian coordinates (bottom panel) for datasets of RR Lyrae (blue squares) and nonvariable giants (orange points). The solid white lines in the top panel depict the approximate footprint of the OGLE survey. In the bottom panel, the black lines indicate the surface density contours (of the analytical potential) for a stellar component rotated by the bar angle (25 degrees). The underlying image in the top panel is the Gaiaall-sky star density map. Image credit: ESA/Gaia/DPAC. Images released under CC BY-SA 3.0 IGO.
Current usage metrics show cumulative count of Article Views (full-text article views including HTML views, PDF and ePub downloads, according to the available data) and Abstracts Views on Vision4Press platform.
Data correspond to usage on the plateform after 2015. The current usage metrics is available 48-96 hours after online publication and is updated daily on week days.
Initial download of the metrics may take a while.