Fig. D.7
Download original image
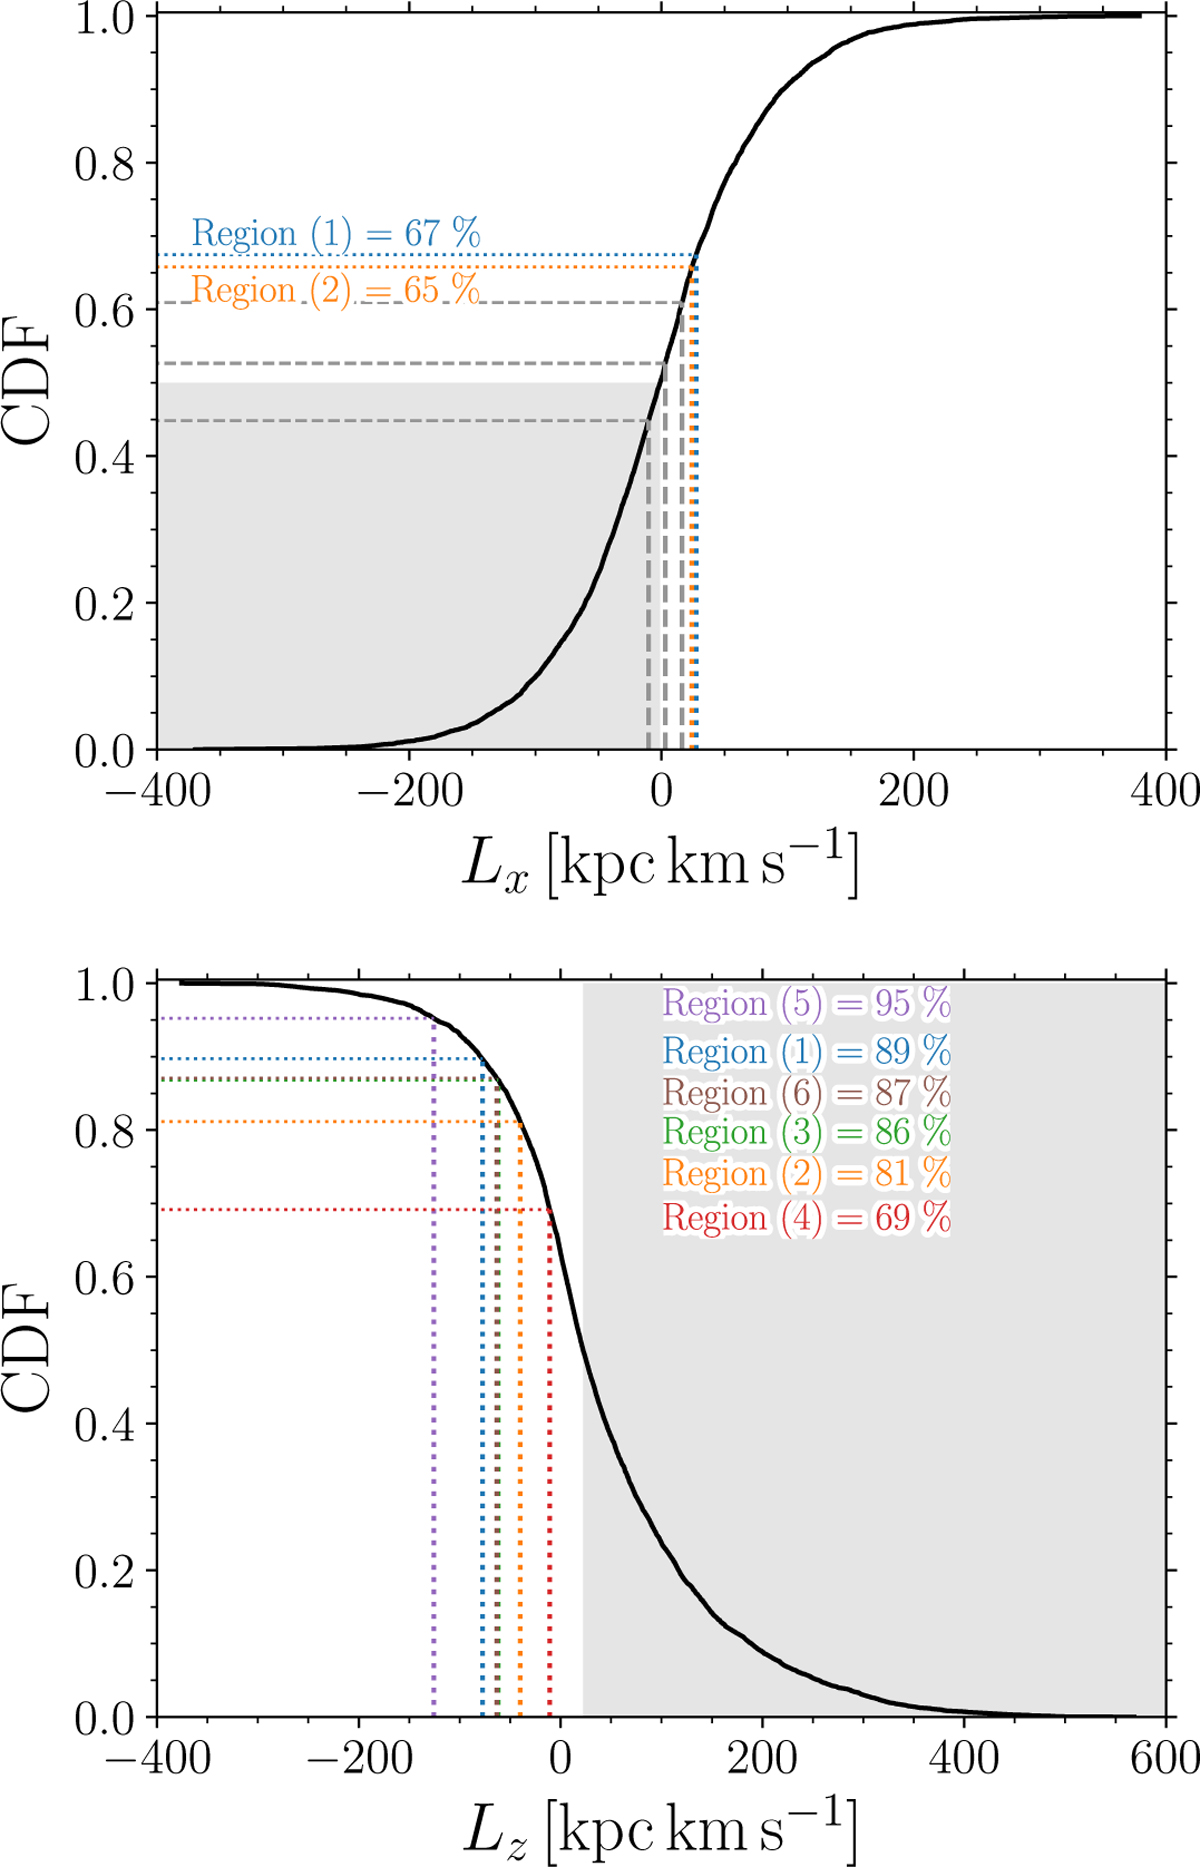
Similar to Figure D.2 we display cumulative distribution for Lx (top panel) and Lz (bottom panel) of our retrograde RR Lyrae dataset. With color-coded dotted lines, we highlighted the median angular momenta values for selected regions from the retrograde frequency map (Figure 14). The filled gray rectangles outline percentile 50 and lower for Lx and 50 and higher for Lz.
Current usage metrics show cumulative count of Article Views (full-text article views including HTML views, PDF and ePub downloads, according to the available data) and Abstracts Views on Vision4Press platform.
Data correspond to usage on the plateform after 2015. The current usage metrics is available 48-96 hours after online publication and is updated daily on week days.
Initial download of the metrics may take a while.