Fig. 3
Download original image
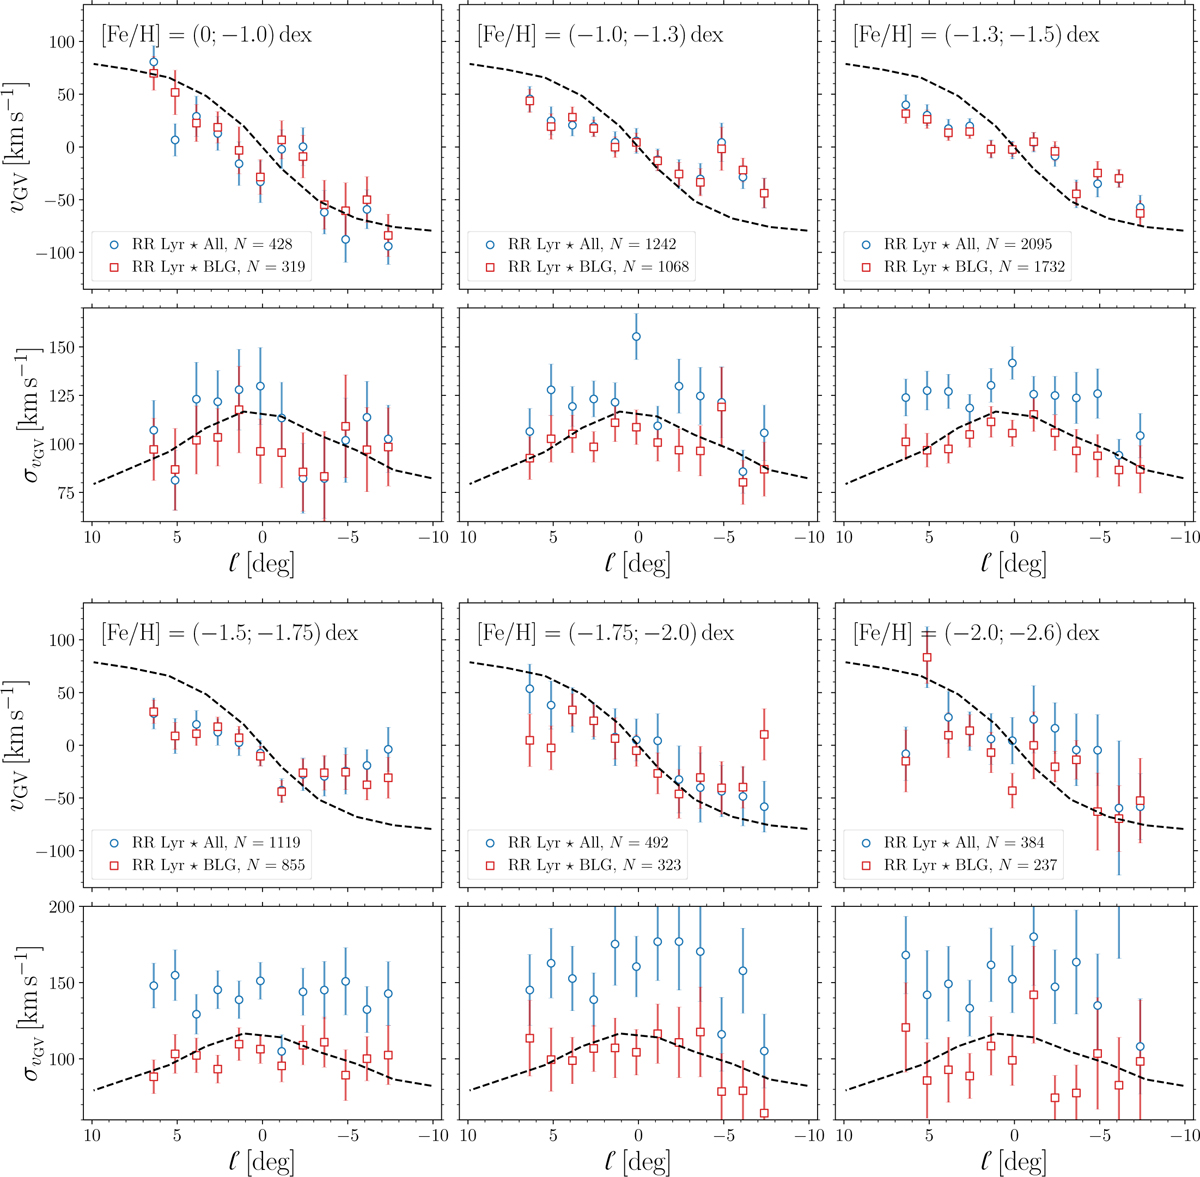
Distribution of the average vGV and its dispersion σvGV in the Galactic longitude bins and for different photometric metallicity cuts. The blue points represent the final dynamical dataset, and the red squares stand for RR Lyrae variables with rapo < 3.5 kpc (labeled BLG in the legend). The dashed lines trace the vGV and σvGV from the bar model of Shen et al. (2010) for b = 4 deg. For this figure, we use equally spaced bins between ℓ = (−8.0; 8.25) deg with a step of 1.25 deg. The asymetric distribution in ℓ was driven by our RR Lyrae dataset.
Current usage metrics show cumulative count of Article Views (full-text article views including HTML views, PDF and ePub downloads, according to the available data) and Abstracts Views on Vision4Press platform.
Data correspond to usage on the plateform after 2015. The current usage metrics is available 48-96 hours after online publication and is updated daily on week days.
Initial download of the metrics may take a while.