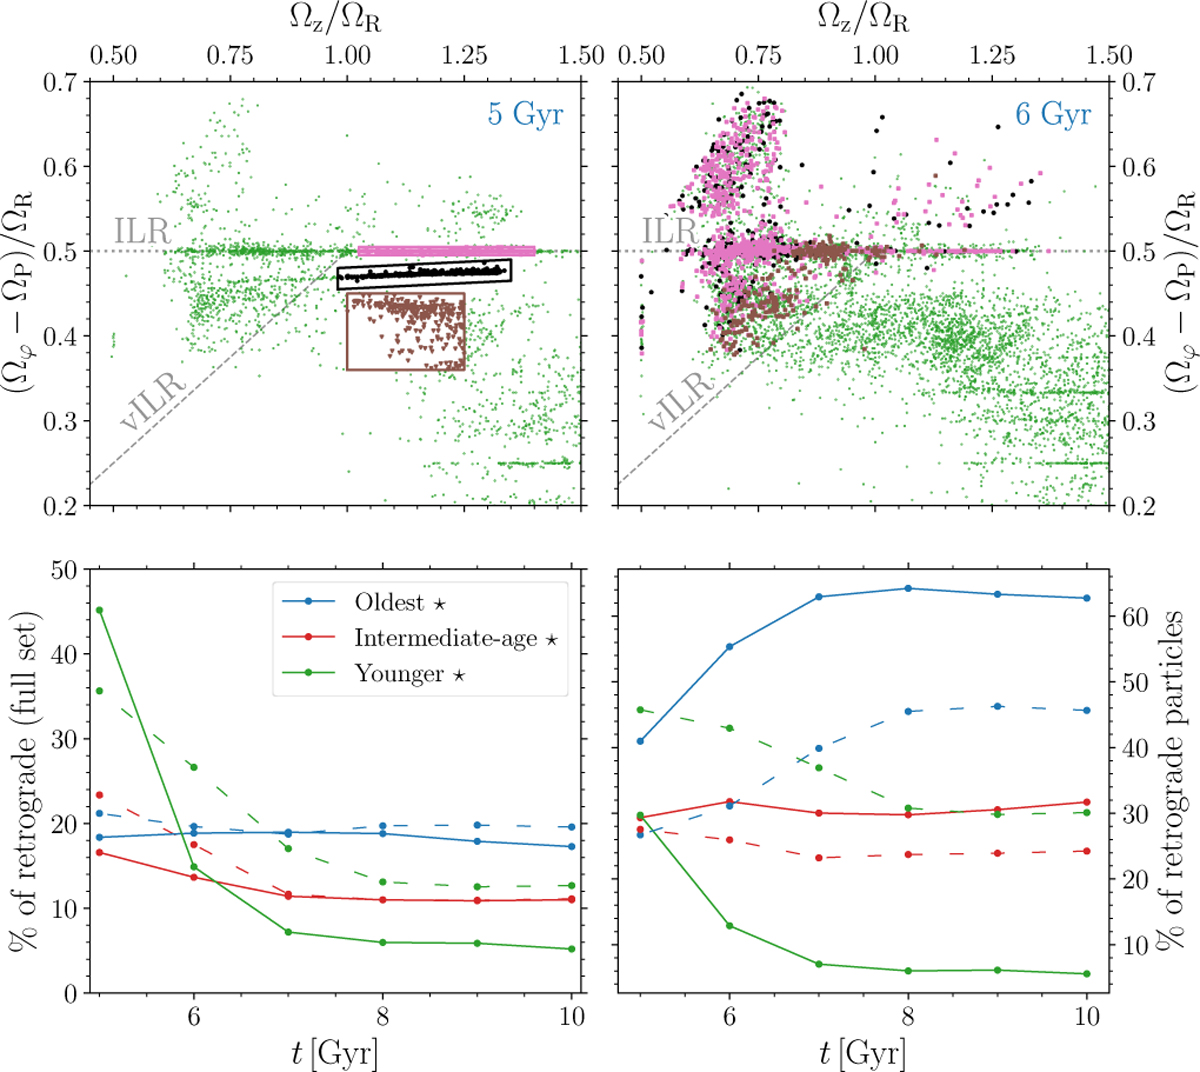
Fig. 19
Download original image
Frequency maps (top panels) and the fraction of retrograde stellar particles (bottom panels) of different ages in several snapshots. The top panels display the distribution of younger stellar particles in frequency maps for two different snapshots. Three groups of stellar particles are selected colored brown, pink and black and brown, in the initial snapshot (left panel, at 5 Gyr) and traced in the following snapshot (right panel at 6 Gyr). Similar to Figure 15, the two main resonances are marked with dashed lines. The bottom panels show the fraction of retrograde stars within the total sample (left bottom panel) and the fraction split by formation age within the retrograde category (for a given snapshot) alone (right bottom panel). The solid lines represent analyses conducted on the dataset where the condition in Eq. (14) was applied, while the dotted lines represent the entire dataset. The blue, red, and green lines represent the oldest (age 9–10 Gyr), intermediate (age 8–9 Gyr), and youngest (age 5–6 Gyr) stellar particles, respectively.
Current usage metrics show cumulative count of Article Views (full-text article views including HTML views, PDF and ePub downloads, according to the available data) and Abstracts Views on Vision4Press platform.
Data correspond to usage on the plateform after 2015. The current usage metrics is available 48-96 hours after online publication and is updated daily on week days.
Initial download of the metrics may take a while.