Open Access
Fig. 15
Download original image
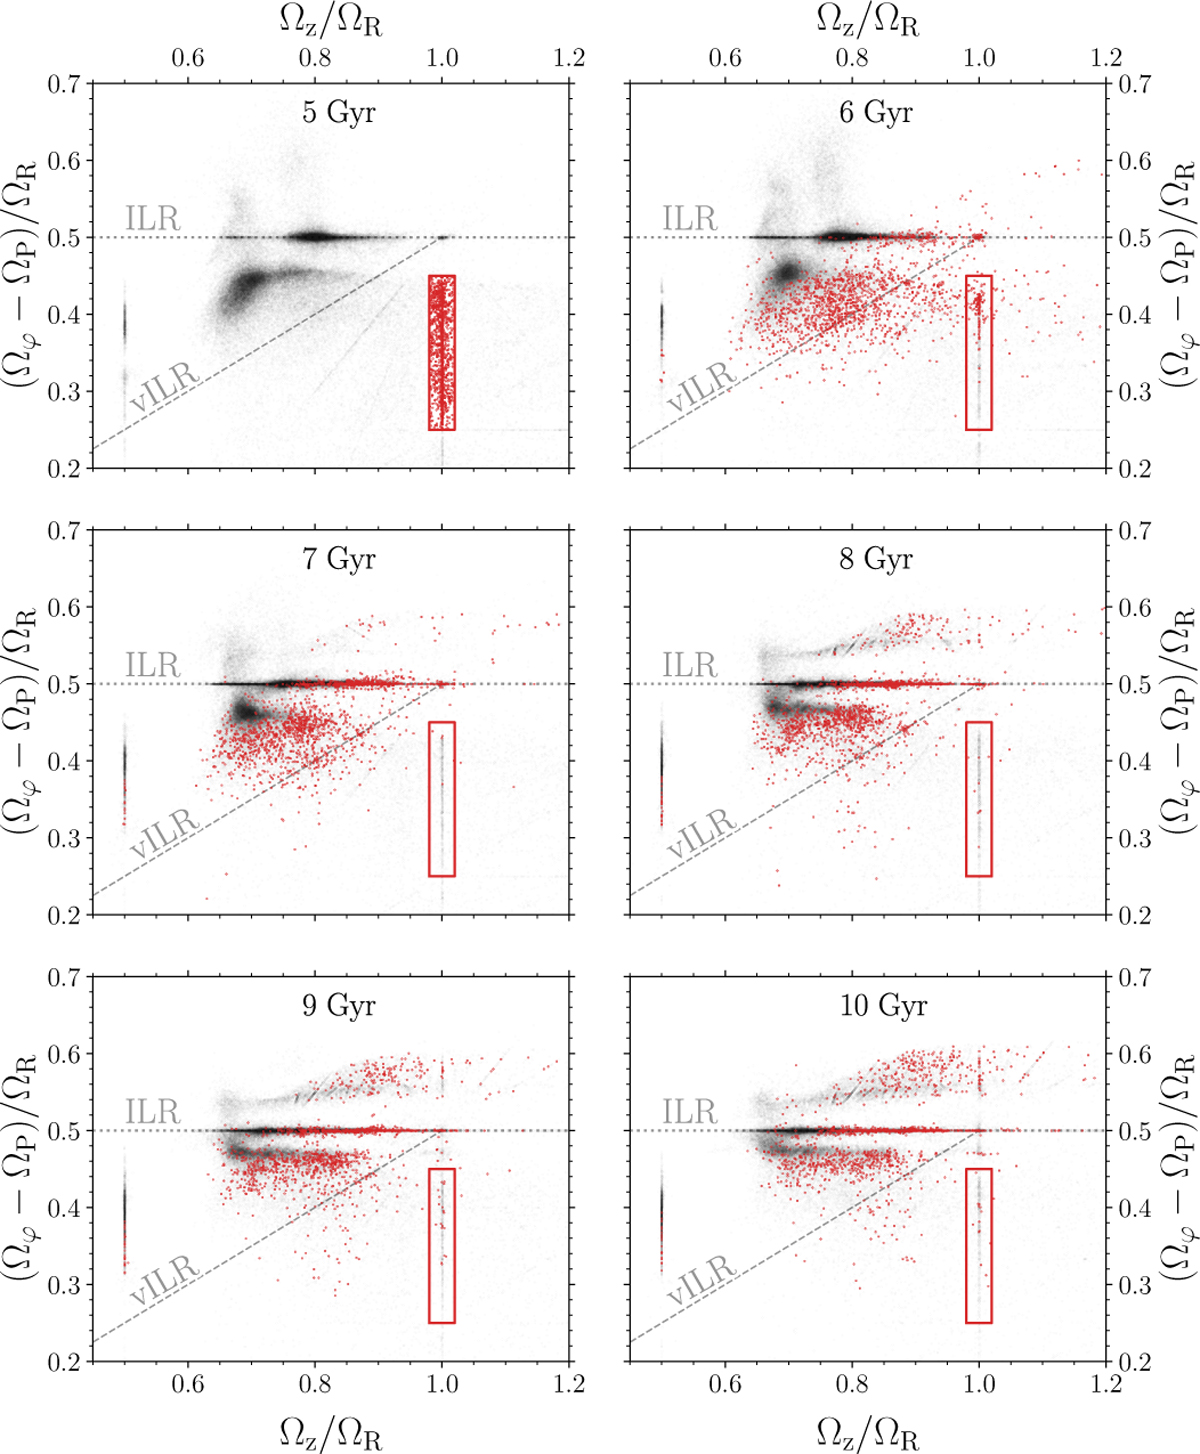
Frequency maps for the same prograde stellar particles in six simulation snapshots. As in Figure 13, we depict two main resonances with dashed lines. The red dots represent stellar particles at resonance around Ωz/ΩR ≈ 1.0 (at 5 Gyr), that we trace to 10 Gyr.
Current usage metrics show cumulative count of Article Views (full-text article views including HTML views, PDF and ePub downloads, according to the available data) and Abstracts Views on Vision4Press platform.
Data correspond to usage on the plateform after 2015. The current usage metrics is available 48-96 hours after online publication and is updated daily on week days.
Initial download of the metrics may take a while.