Fig. 12
Download original image
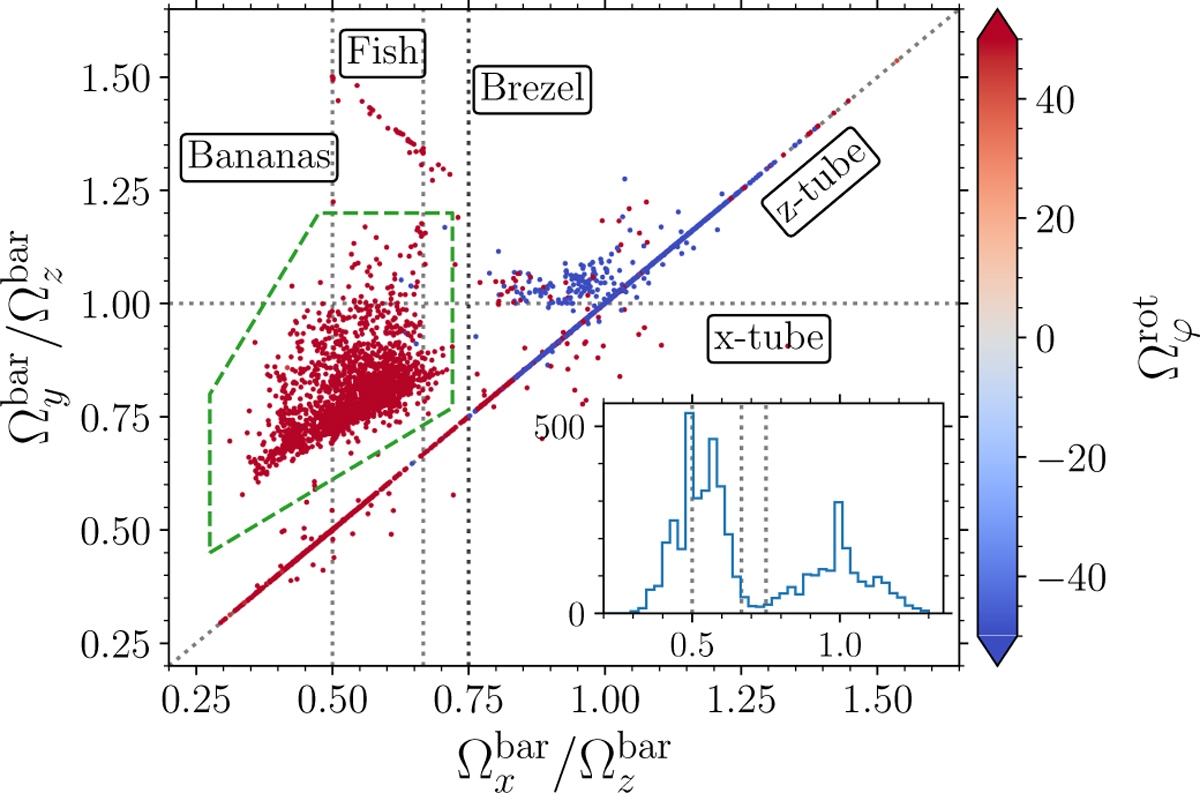
Frequency map illustrating fundamental frequencies in the Cartesian coordinate system and bar-rotating reference frame for our RR Lyrae dataset. The color-coding is used to represent positive and negative values of ![]() . Major orbital families are labeled and delineated with dotted lines. Additionally, dashed green lines highlight a region above the z-tube resonance. In the inset, we present the distribution of
. Major orbital families are labeled and delineated with dotted lines. Additionally, dashed green lines highlight a region above the z-tube resonance. In the inset, we present the distribution of ![]() using the same vertical dotted gray lines as in the main panel.
using the same vertical dotted gray lines as in the main panel.
Current usage metrics show cumulative count of Article Views (full-text article views including HTML views, PDF and ePub downloads, according to the available data) and Abstracts Views on Vision4Press platform.
Data correspond to usage on the plateform after 2015. The current usage metrics is available 48-96 hours after online publication and is updated daily on week days.
Initial download of the metrics may take a while.