Fig. 11
Download original image
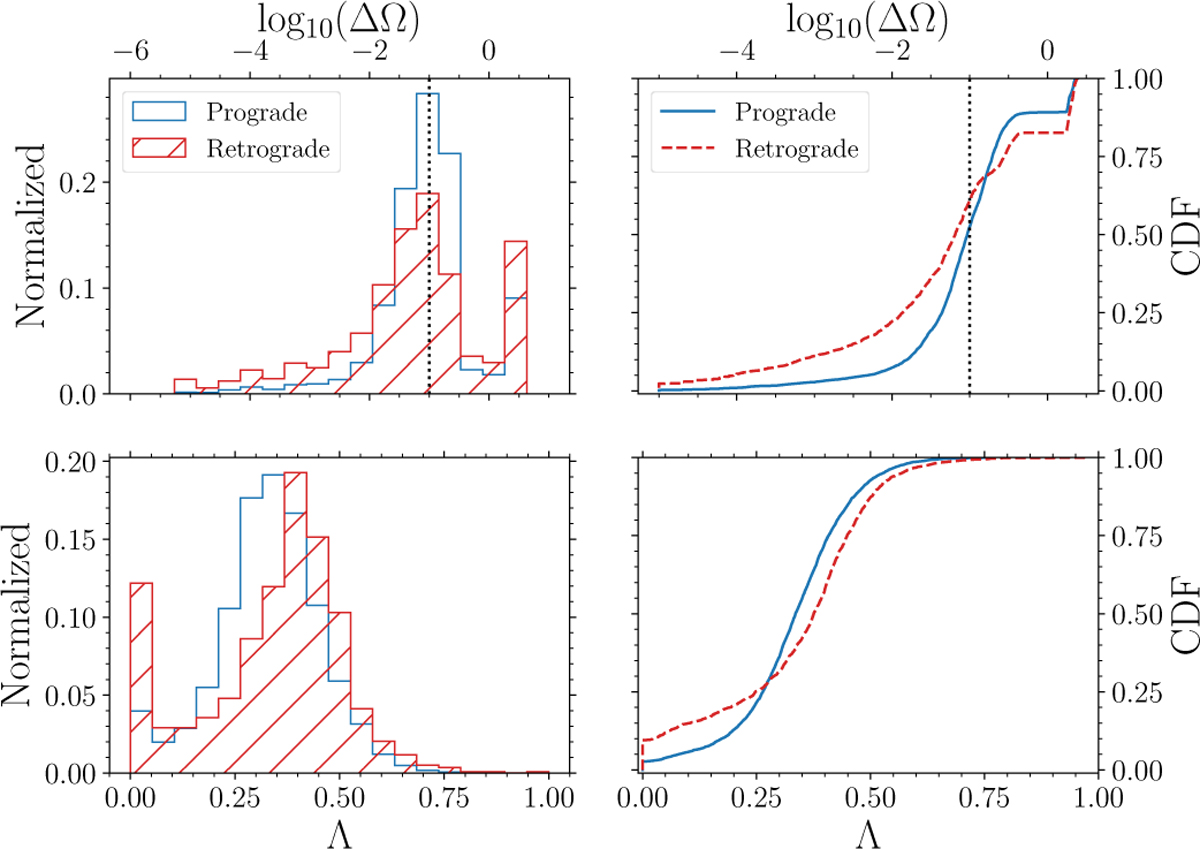
Distribution (left panels) and cumulative distribution functions (right panels) of the frequency drift (top panels) and Lyapunov exponent (bottom panels) for retrograde (red lines) and prograde (blue lines) RR Lyrae stars. The vertical black lines in the upper panels denote our separation between chaotic and regular orbits (see Eq. (13)).
Current usage metrics show cumulative count of Article Views (full-text article views including HTML views, PDF and ePub downloads, according to the available data) and Abstracts Views on Vision4Press platform.
Data correspond to usage on the plateform after 2015. The current usage metrics is available 48-96 hours after online publication and is updated daily on week days.
Initial download of the metrics may take a while.