| Issue |
A&A
Volume 699, July 2025
|
|
|---|---|---|
| Article Number | A147 | |
| Number of page(s) | 8 | |
| Section | Stellar atmospheres | |
| DOI | https://doi.org/10.1051/0004-6361/202554684 | |
| Published online | 03 July 2025 | |
Searching for planet-induced radio signals from the young close-in planet host star HIP 67522
1
ASTRON, Netherlands Institute for Radio Astronomy,
Oude Hoogeveensedijk 4,
Dwingeloo
7991
PD,
The Netherlands
2
Kapteyn Astronomical Institute, University of Groningen,
PO Box 800,
9700
AV,
Groningen,
The Netherlands
3
Anton Pannenkoek Institute for Astronomy, University of Amsterdam,
Science Park 904,
1098
XH
Amsterdam,
The Netherlands
★ Corresponding author: This email address is being protected from spambots. You need JavaScript enabled to view it.
Received:
21
March
2025
Accepted:
3
June
2025
Abstract
HIP 67522 is a 17 Myr old 1.2 M⊙ dwarf. It is the only such young star known to host two close-in gas giant planets. The inner planet likely orbits close enough to its host to power magnetic star-planet interactions. In the radio domain, magnetic star-planet interaction is expected to produce a unique signature: electron cyclotron maser emission (ECME), beamed in phase with the orbit of the close-in planet. We conducted the longest radio monitoring campaign of a G dwarf host star to date to search for ECME, totaling 135 h on HIP 67522 over a period of five months with the Australia Telescope Compact Array (ATCA) between 1.1 – 3.1 GHz. We find that HIP 67522 is active in the radio, with emission that varies stochastically, with a duty cycle of 69% above 0.24 mJy, and frequent bursts. Both the bursts and the quiescent emission are consistent with the canonical Güdel-Benz relation, and show a positive spectral index and brightness temperatures ≥ 1010 K, indicating likely a flaring origin. Our observations cover 61% of the innermost planet’s orbit, including multiple visits of the quadrature where planet-induced ECME detection is most likely for this system. However, no orbital modulation or persistent polarization of the radio emission was detected. Our upper limit on circularly polarized emission from HIP 67522 suggests a <0.7% conversion efficiency of the magnetic power generated in the star-planet interaction into radio waves, unless the emission was missed by our phase or frequency coverage, or was absorbed in the circumstellar plasma. HIP 67522 is a system with one of the highest expected powers of star-planet interaction among known systems and shows strong indication of planet-induced flaring, motivating observations at other wavelengths to probe for additional dissipation pathways.
Key words: planet-star interactions / stars: activity / stars: flare / radio continuum: stars
© The Authors 2025
 Open Access article, published by EDP Sciences, under the terms of the Creative Commons Attribution License (https://creativecommons.org/licenses/by/4.0), which permits unrestricted use, distribution, and reproduction in any medium, provided the original work is properly cited.
This article is published in open access under the Subscribe to Open model. This email address is being protected from spambots. You need JavaScript enabled to view it. to support open access publication.
1 Introduction
Recently, many close-in planets have been found to experience harsh space weather conditions. Their atmospheres react to the bombardment with their host star’s X-ray and UV emission by heating up and expanding, which can be measured as low bulk or atmospheric density (Laughlin et al. 2011; Barkaoui et al. 2024; Thao et al. 2024), or spectroscopic signatures of escaping material (Lecavelier Des Etangs et al. 2010; Ehrenreich et al. 2015; Spake et al. 2021). After millions to billions of years of atmospheric erosion, some planets end up with a much smaller atmosphere than they were born with, and others with no atmosphere at all (Tian 2015; Ketzer & Poppenhåger 2023; Van Looveren et al. 2024). Conversely, a sufficiently close-in planet may also influence its host star’s evolution (Shkolnik & Llama 2018). The planet presents an obstacle to the star’s magnetic field, and may set off Alfvén waves in the stellar magnetosphere that can propagate back to the star. A detectable fraction of the energy carried by the Alfvén waves could be emitted in the radio wave band via the electron cyclotron maser emission (ECME) in the radio (Zarka et al. 2001; Treumann 2006; Hess & Zarka 2011; Kavanagh et al. 2021; Callingham et al. 2024).
Searches for planet-induced ECME have so far been inconclusive. The τ Boo system hosts a close-in hot Jupiter and has shown tentative low-frequency ECME (Turner et al. 2021). Nevertheless, the signal could not be recovered in follow-up observations (Turner et al. 2024; Cordun et al. 2025). Polarized radio emission has also been detected on GJ 1511, a star that may be too inactive to produce ECME purely through stellar activity (Vedantham et al. 2020), but a planet in close orbit has yet to be detected (Blanco-Pozo et al. 2023). Similarly, no planet has yet been detected in close orbit around brown dwarfs. Meanwhile, ECME is the main source of their radio emission (Hallinan et al. 2008, 2015). Close-in planets have been detected around AU Mic (Plavchan et al. 2020; Martioli et al. 2021), as well as ECME (Bloot et al. 2024), but the emission was modulated with the rotational period of the star and could be linked to the presence of planets directly. Hints of ECME modulated with a planet’s orbital period have been suggested for YZ Cet (Pineda & Villadsen 2023) and Proxima Cen (Pérez-Torres et al. 2021). However, long-term monitoring is required to rule out coincidental intrinsic stellar emission.
Long-term monitoring for ECME requires careful target selection. The HIP 67522 system (Table 1) is a 17 Myr member of the Upper Centaurus Lupus part of the Sco-Cen OB association (de Zeeuw et al. 1999; Rizzuto et al. 2020) at a distance of 125 pc (Gaia Collaboration 2021). The host star is a 1.2 M⊙ dwarf (Rizzuto et al. 2020) with a low-density giant planet with an expanded atmosphere (Thao et al. 2024) in a 6.95 d orbit (Rizzuto et al. 2020), and another recently confirmed gas giant in a 14.33 d orbit (Barber et al. 2024). The star is oriented equator-on, and the innermost planet has low obliquity (Heitzmann et al. 2021). With one of the highest predicted powers produced in star-planet interactions (Strugarek et al. 2022; Ilin et al. 2024) and a recent detection of significant flare clustering with orbital phase, strongly suggesting planet-induced emission (Ilin et al. 2025), HIP 67522 is a promising target for a search for periodic bursts of interaction-driven ECME, unambiguously identified by their occurrence in phase with the orbit of the interacting planet.
Stellar parameters of HIP 67522 and orbital parameters of HIP 67522 b.
2 Radio observations and analysis
We observed HIP 67522 from April 7 to July 15, 2024, with the Australian Telescope Compact Array (Project ID: C3591, PI: Ilin) for a total of 134.7 h on target, searching for periodic occurrence of ECME (Fig. 1 and Table 2). We conducted observations in L/S band, i.e., 1.1 – 3.1 GHz, with a 10 s integration time and 1 MHz channel width using the 2 GHz Compact Array Broadband Backend (CABB, Wilson et al. 2011).
We observed PKS B0823-500 as one of our primary calibrators at the start of the observations, because the standard primary calibrator for L band, PKS B1934-638, was usually at too low an elevation at the start of our runs. We also observed PKS B1934-638 at the end of each run. PKS B0823-500 and PKS B 1934-638 were each observed for 10 min. During the rest of each observation, we alternated between 3 min on the secondary calibrator, PKS B 1424-418, and 40 min on target.
We reduced the observations with CASA (version 6.6.0.20, Team et al. 2022). Radio frequency interference (RFI) in the 1.1 – 3.1 GHz band was ubiquitous, which led to flagging of 30 –60% of the data before calibration. We used the TFCrop algorithm that identifies outliers in the time-frequency plane, cutting at 3.5 and 4 standard deviations in frequency and time, respectively. The baseline for the cut is calculated using a polynomial and linear fit in frequency and time, respectively. After visual inspection, further manual flagging was required in some cases.
We used PKS B1934-638 as the flux density and bandpass calibrator for all except one observation. On June 26, 2024, the observation of PKS B1934-638 was subject to so much RFI that the calibration solutions did not converge, so we used PKS B0823-500 instead. For phase calibration, we used PKS B1424-418 in all runs.
We calculated the complex gains, spectral bandpass, polarization and polarization leakage solutions from PKS B1934-638 or PKS B0823-500, using CA06 as reference antenna for the phase solutions, and 60 s as solution interval, during which we assumed that the phase remained constant. After a first phase calibration on the bandpass calibrator, we performed a bandpass calibration on the same object, which were applied to the primary (bandpass) and secondary calibrator data. We transferred the solutions for the bandpass and gain to derive the polarization calibration using the bandpass calibrator and the qufromgain task from casarecipes.atcapolhelpers.
As the final product, we made images of the target based on the calibrated measurement sets, and extracted point source flux density and background from each image. We used tclean with a manual mask to construct images in different time intervals, including entire observing runs of about 5 –10 h each, 1 h for the general time series, and 30 min during a large burst. In all observations, we removed antenna CA03, which suffered from an instrumental defect throughout our campaign. In Stokes I, we also removed baselines shorter than 500 m (in the H168 configuration, this removes all but 4 baselines) to further reduce RFI and contamination from the side lobes of a bright resolved source about 9′ away from the target. Due to the bright source, we used the multiscale algorithm for the minor cycles of the cleaning process in Stokes I, and continued the cleaning until the target emission was reduced to background levels. In Stokes V, no other sources appeared nearby our target, so we used the hogbom point source model instead. We used imstat to extract the point source flux density as the maximum value in the beam of the target, and background as the standard deviation of a nearby, source-free region from the final images.
We detected one large burst, of which we extracted the dynamic spectrum from the observations in Stokes I, following the approach outlined by Bloot et al. (2024). We imaged the observations in 6000 × 6000 pixels, i.e., 2.4′′ × 2.4′′ pixel size, using WSClean (Offringa et al. 2014) to generate a model of all sources but HIP 67522, subtracted all sources but HIP 67522 from the image with the CASA task uvsub, then phase-shifted the measurements at each epoch with DP3 (van Diepen et al. 2018) to the location of HIP 67522, which we determined from the maximum flux pixel in the residual image.
We defined any observation as a detection if the signal-to-noise ratio was S/N < 4, and coincided with a point source in the image at the location of HIP 67522 (see Fig. A.1). Otherwise, we defined the upper limit as four times the RMS noise. Assuming that the entire stellar disk at 1 R* is a uniformly emitting area, the emission is isotropic, and the distance is d = 124.7 pc (see Table 1), we computed the radio luminosity, LR, and the characteristic brightness temperature, Tb, with
 (1)
(1)
where c is the speed of light, v0 is the center frequency in the L band at 2.1 GHz, Sv is the flux density, R* and d are the photometric radius and distance of the star, and kB is the Boltzmann constant. For the only observing run with a Stokes V detection, on April 26, 2024, we additionally calculated the degree of circular polarization as the ratio of the average flux density in Stokes V to that in Stokes I.
3 Results
The quiescent flux density in the 1.1 – 3.1 GHz band of ATCA was on average 0.26 ± 0.02 mJy, or a luminosity of (4.8 ± 0.4) × 1015 erg s−1 Hz−1 obtained from the full integration images of each run with detections, excluding the June 11 and May 11 observations, which we treated as burst episodes. The corresponding brightness temperature at the central wavelength of 2.1 GHz was (1.0 ± 0.1) × 1010 K. The radio emission was unpolarized in all observations except for the run on April 26, where we marginally detect a polarization fraction SV/SI = 22 ± 6% for the full run. However, we could not temporally resolve the polarization signal due to a low signal-to-noise ratio of the emission.
The quiescent emission was not detectable in all ATCA epochs, which was sometimes due to worse RFI conditions that increased the noise of an observation, but also due to lower emission from the star. At 1-h time resolution, the lowest detected flux density was in the April 21 epoch at Fthresh = 0.24 ± 0.07 mJy. We defined the emission in HIP 67522 as “on” for any flux density F ≥ Fthresh, and as “off” whenever no flux was detected and the upper limit was below Fthresh. With this definition, we found a duty cycle of radio emission of ∼ 69%. Folding the light curves with the orbital period of HIP 67522 b does not reveal any significant modulation in phase with the planet’s orbit (Fig. 2). The polarized emission on April 26 occurred close to transit, but was not detected during any of the two later observations in that phase range.
In the epochs with detected emission, we split the frequency band in four 500 MHz-wide sub-bands, and extracted images following the procedure described in Section 2 for the full runs. From the four bands we then calculated the spectral index assuming Sv ∝ vα. Fitting spectra from individual runs yielded spectral indices ranging from 0.8 to 2.1, but the higher indices were only associated with the faintest three spectra. Assuming that all spectra share the same index, we performed a joint least square fit to the linearized power law, which yielded α ≈ 1.0, suggesting that the emission was optically thick at 1.1 – 3.1 GHz (Fig. 3).
Over the course of 134.7 h, HIP 67522 showed one strong burst on June 11 (Fig. 4), and a potential burst seen as a turnover at the beginning of the observing run on May 11, followed by a prolonged emission decay (see second row, right column in Fig. 1). The flux density rose to peak values of 1.45 mJy and 0.69 mJy, or 2.7 × 10¹⁶ erg s−1 Hz−1 and 1.3 × 10¹⁶ erg s−1 Hz−1 on June 11 and May 11, respectively. The corresponding brightness temperatures are 5.4 × 10¹⁰ K and 2.6 × 10¹⁰ K, respectively. The June 11 burst was bright enough to extract a dynamic spectrum from the data (Fig. 4). The spectrum shows a positive spectral index consistent with the quiescent emission (Fig. 3), but no obvious drift in frequency over time.
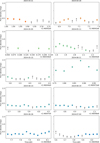 |
Fig. 1 Light curves of Stokes I flux density in the 1.1 – 3.1 GHz band of ATCA, with one panel for each observing run where HIP 67522 was detected. Gray arrows indicate non-detections, with arrow length corresponding to the 1 – σ RMS noise. |
ATCA observing log.
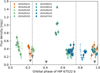 |
Fig. 2 ATCA Stokes I light curves from Fig. 1 folded with the orbital period of HIP 67522 b (transit midtime set to phase 0). Colored downward arrows indicate non-detections in a 1 h interval of a run with a significant source detection in the integrated image. Gray triangles indicate that the entire observing run yielded a non-detection. Dashed gray lines mark the quadratures of HIP 67522 b. The Stokes I emission does not show any variability in phase with the planet’s orbit. Error bars indicate 1 – σ RMS noise. |
4 Discussion
The quiescent radio emission from HIP 67522 is typical of coronal emission in other cool dwarfs (Section 4.1), and the properties of both bursts and quiescence are compatible with emission from accelerated electrons during flares (Section 4.2). Assuming that flares occurring at the same rate in both optical and radio correspond to events of the same total energy, we can use the optical flare rate to infer the flare energies corresponding to the detected bursts. We find that neither of the bursts could be detected with Transiting Exoplanet Survey Satellite (TESS, Ricker et al. 2015), and only the brightest could be marginally detected with the CHaracterising ExOPlanet Satellite (CHEOPS, Benz et al. 2021). The radio emission does not show any signs of star-planet interaction, which may indicate a low efficiency of dissipation via ECME, but may also be explained by reabsorption of the emission, beaming effects, or observational constraints (Section 4.3).
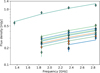 |
Fig. 3 Radio spectra of HIP 67522 (diamonds, same color-coding as in Fig. 2), along with power-law fits (lines). Fitting all spectra jointly, as shown here, yields a spectral index of ≈ 1.0. |
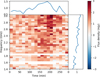 |
Fig. 4 Dynamic spectrum of the June 11, 2024, radio burst. We omitted frequencies below 1.4 GHz, which were dominated by RFI. The burst mostly occupies higher frequencies, likely beyond the 3.1 GHz limit, and its spectrum shows a positive slope (right panel, see also Fig. 3). |
4.1 Güdel-Benz relation
The Güdel-Benz relation (GBR) identifies coronal emission by the relation between centimeter radio and X-ray luminosity, originally derived from ROSAT (Truemper 1982) observations at 0.1 – 2.5 keV, and Karl G. Jansky Very Large Array (VLA, Perley et al. 2011) observations at 5 – 8.5 GHz (Guedel & Benz 1993; Gudel et al. 1994). The relationship can also help determine incoherent and coherent radio emission processes (Callingham et al. 2024). We use the following fit derived by Williams et al. (2014), who extended the observations to ultracool dwarfs with Chandra (0.2 – 2.0 keV) and VLA in Berger et al. (2010):
 (2)
(2)
Maggio et al. (2024) report a quiescent X-ray luminosity for HIP 67522 in XMM-Newton’s 0.3 – 10 keV band of log10 LX = 30.5 erg s−1. For comparison with the above relation, we computed the X-ray luminosity of HIP 67522 in the 0.2 – 2.0 keV band using the quiescent emission parameters in Table 1 in Maggio et al. (2024) using pyxspec (Gordon & Arnaud 2021), which yielded log10 LX=30.8 erg s−1, and log10 LR=16.0 ± 0.6 erg s−1 Hz−1, predicted by GBR. The mean quiescent flux in ATCA’s L and S band observations was log10 LR=15.69 ± 0.04 erg s−1 Hz−1. We can use the spectral index of ≈ 1 and the mean quiescent flux density from our observations to extrapolate what LR would be at the mid-frequency of the VLA band, to which the GBR is calibrated, which yields log10 LR=16.2 ± 0.4 erg s−1 Hz−1, consistent with the GBR prediction. The high radio luminosity of HIP 67522 puts it in company with other young stars (e.g., T Tauri and RS CVn Guedel & Benz 1993; Yiu et al. 2024; Davis et al. 2024). The consistency of the emission with the GBR suggests most likely the radio emission is incoherent in nature.
4.2 Radio emission mechanism
HIP 67522’s emission is characterized by a brightness temperature ≥ 1010 K, a positive spectral index α ≈ 1, burst-like variability, weakly polarized emission, and consistency with the GBR. The high brightness temperature rules out thermal emission, which is limited to ≤ 108 K for a typical corona on a solar type star (Güdel 2004). The detected bursts, and the consistency with the GBR suggest that the emission is related to particle acceleration in flares (see Yiu et al. 2024; Davis et al. 2024 for similar conclusions). Osten et al. (2005) measured positive spectral indices at 5 GHz and low degree of polarization during the early phases of a large flare on the active M dwarf EV Lac. As in their work, our spectral index is too flat to be consistent with typical power law electron distributions of the form n(E) ∝ E−δ with δ ≈ 2 – 7 (Dulk & Marsh 1982; Dulk 1985), potentially indicating multiple coexisting electron populations. In Osten et al. (2005), the late decay phases showed a moderate degree of circular polarization and negative spectral index, indicating a decrease in optical depth, which we did not detect at any time during our monitoring. We speculate that the L and S band emission in HIP 67522 was dominated by the combined peak emission of a population of frequent flares, two of which were bright enough to pass the detection threshold as individual bursts.
If the June 11 and May 11 bursts were directly related to flares, we can use the full observing duration of Δt = 134.7 h and compare the occurrence rate to the corresponding flare rate in the optical flare frequency distribution, derived from flares observed with TESS (Ilin et al. 2024) and CHEOPS (Ilin et al. 2025). The flux turnover in the May 11 burst overlaps with a visit by CHEOPS, but no optical flare was detected during or prior to the burst. Yet, the non-detection is consistent with the burst being associated with an undetected flare. The energy of a flare that would occur twice per Δ t would have a bolometric energy 5 × 1033 erg, below the detection threshold of TESS and marginally detectable with CHEOPS, assuming rate equivalence as discussed above. However, the instrumental noise level during that particular CHEOPS visit was higher than average, so that a flare of that energy could remain undetected.
4.3 Star-planet interaction
In the radio band, we did not find any highly circularly polarized emission that could identify a magnetic interaction between the planet and the star, or any other modulation in radio emission with the orbital phase of HIP 67522 b (Fig. 2). Assuming a simple stellar dipole magnetic field aligned with the rotation axis of the star, and an opening angle of the emission cone of EMCE of nearly 90 deg, planet-induced emission should be detected around quadrature phase, which was visited four times during the campaign. A more complex field could produce ECME that may have been missed by our 61% phase coverage, or beam the emission away from the line of sight entirely. But even if the dipole field assumption is correct, an absence of periodically recurring ECME does not rule out the presence of star-planet interaction for three reasons. First, ECME may be present, but become reabsorbed during propagation in the stellar magnetosphere (Melrose & Dulk 1982). Second, the conditions for ECME to escape may be present, but only farther out in the magnetosphere, i.e., at weaker magnetic field strengths. The emission wavelength vB=2.8 × B[G] MHz and its low order harmonics would then be seen at frequencies observable by instruments such as LOFAR, i.e., 144 MHz (Pope et al. 2021; Callingham et al. 2021), and not in ATCA’s gigahertz bands. Third, multiple mechanisms (Lanza 2018; Saur et al. 2013) are potentially capable of dissipating the energy from star-planet interactions in the stellar corona or chromosphere (Scharf 2010; Poppenhaeger & Schmitt 2011; Shkolnik et al. 2008; Cauley et al. 2019). Dissipation via the ECM channel requires particular conditions that convert the Alfvén wave energy into an unstable particle distribution.
If some of the interaction flux dissipates and escapes through the ECME mechanism in ATCA’s L and S bands, we can place an upper limit based on our non-detections of the system in Stokes V. The average upper limit throughout the observing campaign, calculated as the four-fold RMS noise, was 1.1 mJy, based on a 30 min long burst spread over the full integration, which would correspond to an emission cone width of about 1 deg. Assuming an average surface field strength of 2100 G (Ilin et al. 2024) and that the large-scale field strength is ∼ 20% of that value for very active stars (Reiners et al. 2022; Kochukhov et al. 2020), we can rule out ECM radio power values in excess of 4.3 × 10²³ erg/s. The corresponding efficiency is approximately 7 × 10⁻³, based on the estimated power of interaction of 6 × 1025 erg/s in the Alfvén wing mechanism (Saur et al. 2013). This upper limit is consistent with the conversion rate of ∼ 2 – 10 × 10−3 of magnetic interaction power to radio emission between Jupiter and its Galilean moons (Zarka 2007). Therefore, the non-detection of Stokes V emission does not rule out magnetic star-planet interaction in the Alfvén wing scenario.
5 Summary and conclusions
In our 134.7 h radio observing campaign, HIP 67522 appears active and variable, including two bursts, as expected for its young age. The high brightness temperature of the emission, its adherence to the Güdel-Benz relation (see also Maggio et al. 2024), the low degree of polarization, and the positive spectral index suggest that the radio emission is nonthermal and of coronal origin, likely stemming from particle acceleration during flares.
The radio emission showed no modulation in phase with the orbital period of the planet. The upper limit on the Stokes V emission from our observations suggests that Alfvén waves generated by star-planet interaction dissipate less than 0.7% of their power via ECME. However, the absence of measured emission can also be explained by reabsorption in the stellar plasma environment, or by emission at frequencies not captured by ATCA’s 1.1 – 3.1 GHz band. Alternatively, the emission may have occurred at orbital phases not covered by our campaign or beamed away from the line of sight entirely.
Our results place the first constraints on the flux and duty cycle of ECME in a star-planet system with strong clustering of flares in the planetary orbital phase that indicates a planet-induced origin (Ilin et al. 2025). Future (multiwavelength) observations probing the large-scale stellar magnetic field and various dissipation pathways of planet-induced perturbations will be instrumental in deciphering the geometry and energetics of magnetic star-planet interaction in this system. In the radio domain, extended frequency coverage (e.g., with SKA Low, Dewdney et al. 2009) and an order-of-magnitude increase in total observing time would allow us to measure planet-induced modulation of unpolarized radio emission from flares triggered by magnetic interaction (Ilin & Poppenhaeger 2022; Ilin et al. 2024; Fischer & Saur 2019).
Acknowledgements
The authors thank the anonymous referee for helpful comments that improved the manuscript. The Australia Telescope Compact Array is part of the Australia Telescope National Facility, which is funded by the Australian Government for operation as a National Facility managed by CSIRO. We acknowledge the Gomeroi people as the traditional owners of the Observatory site. This paper includes data collected by the TESS mission, which are publicly available from the Mikulski Archive for Space Telescopes (MAST). E.I. and H.K.V. acknowledge funding from the European Research Council under the European Union’s Horizon Europe program (grant number 101042416 STORMCHASER). S.B. acknowledges funding from the Dutch research council (NWO) under the talent program (Vidi grant VI.Vidi.203.093). J.R.C. acknowledges funding from the European Union via the European Research Council (ERC) grant Epaphus (project number: 101166008). All scripts used to reduce the data, and produce the figures, tables, and results in this work are publicly available on GitHub at https://github.com/ekaterinailin/hip67522-spi/tree/radio-spi/.
Appendix A Stokes I detection
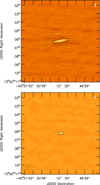 |
Fig. A.1 HIP 67522 detected in Stokes I with ATCA during the June 11 burst (top panel), and in quiescence on June 19 (bottom panel). The bottom left oval indicates the beam in each panel. Contours represent the 3, 5, 7, and 9 RMS noise levels. |
References
- Barber, M. G., Thao, P. C., Mann, A. W., et al. 2024, ApJ, 973, L30 [Google Scholar]
- Barkaoui, K., Pozuelos, F. J., Hellier, C., et al. 2024, NatAs, 8, 909 [Google Scholar]
- Benz, W., Broeg, C., Fortier, A., et al. 2021, Exp. Astron., 51, 109 [Google Scholar]
- Berger, E., Basri, G., Fleming, T. A., et al. 2010, ApJ, 709, 332 [Google Scholar]
- Blanco-Pozo, J., Perger, M., Damasso, M., et al. 2023, A&A, 671, A50 [NASA ADS] [CrossRef] [EDP Sciences] [Google Scholar]
- Bloot, S., Callingham, J. R., Vedantham, H. K., et al. 2024, A&A, 682, A170 [NASA ADS] [CrossRef] [EDP Sciences] [Google Scholar]
- Callingham, J. R., Vedantham, H. K., Shimwell, T. W., et al. 2021, NatAs, 5, 1233 [NASA ADS] [Google Scholar]
- Callingham, J. R., Pope, B. J. S., Kavanagh, R. D., et al. 2024, NatAs, 8, 1359 [Google Scholar]
- Cauley, P. W., Shkolnik, E. L., Llama, J., & Lanza, A. F., 2019, NatAs, 3, 1128 [Google Scholar]
- Cordun, C. M., Vedantham, H. K., Brentjens, M. A., & van der Tak, F. F. S., 2025, A&A, 693, A162 [NASA ADS] [CrossRef] [EDP Sciences] [Google Scholar]
- Davis, I., Hallinan, G., Ayala, C., Dong, D., & Myers, S., 2024, ArXiv e-prints [arXiv:2408.14612] [Google Scholar]
- de Zeeuw, P. T., Hoogerwerf, R., de Bruijne, J. H. J., Brown, A. G. A., & Blaauw, A., 1999, AJ, 117, 354 [Google Scholar]
- Dewdney, P. E., Hall, P. J., Schilizzi, R. T., & Lazio, T. J. L. W., 2009, IEEE Proc., 97, 1482 [Google Scholar]
- Dulk, G. A., 1985, ARA&A, 23, 169 [Google Scholar]
- Dulk, G. A., & Marsh, K. A., 1982, ApJ, 259, 350 [NASA ADS] [CrossRef] [Google Scholar]
- Ehrenreich, D., Bourrier, V., Wheatley, P. J., et al. 2015, Nature, 522, 459 [Google Scholar]
- Fischer, C., & Saur, J., 2019, ApJ, 872, 113 [NASA ADS] [CrossRef] [Google Scholar]
- Gaia Collaboration (Brown, A. G. A., et al.,) 2021, A&A, 649, A1 [NASA ADS] [CrossRef] [EDP Sciences] [Google Scholar]
- Gordon, C., & Arnaud, K., 2021, Astrophysic Source Code Library [record ascl:2101.014] [Google Scholar]
- Gudel, M., Schmitt, J. H. M. M., & Benz, A. O., 1994, Science, 265, 933 [Google Scholar]
- Guedel, M., & Benz, A. O., 1993, ApJ, 405, L63 [NASA ADS] [CrossRef] [Google Scholar]
- Güdel, M., 2004, Astron. Astrophys. Rev., 12, 71 [Google Scholar]
- Hallinan, G., Antonova, A., Doyle, J. G., et al. 2008, ApJ, 684, 644 [Google Scholar]
- Hallinan, G., Littlefair, S. P., Cotter, G., et al. 2015, Nature, 523, 568 [NASA ADS] [CrossRef] [Google Scholar]
- Heitzmann, A., Zhou, G., Quinn, S. N., et al. 2021, ApJ, 922, L1 [NASA ADS] [CrossRef] [Google Scholar]
- Hess, S. L. G., & Zarka, P., 2011, A&A, 531, A29 [NASA ADS] [CrossRef] [EDP Sciences] [Google Scholar]
- Ilin, E., & Poppenhaeger, K., 2022, MNRAS, 513, 4579 [NASA ADS] [CrossRef] [Google Scholar]
- Ilin, E., Poppenhåger, K., Chebly, J., Ilić, N., & Alvarado-Gómez, J. D., 2024, MNRAS, 527, 3395 [Google Scholar]
- Ilin, E., Vedantham, H., Poppenhaeger, K., et al. 2025, Nature, in press, https://doi.org/10.1038/s41586-025-09236-z [Google Scholar]
- Kavanagh, R. D., Vidotto, A. A., Klein, B., et al. 2021, MNRAS, 504, 1511 [Google Scholar]
- Ketzer, L., & Poppenhåger, K., 2023, MNRAS, 518, 1683 [Google Scholar]
- Kochukhov, O., Hackman, T., Lehtinen, J. J., & Wehrhahn, A., 2020, A&A, 635, A142 [NASA ADS] [CrossRef] [EDP Sciences] [Google Scholar]
- Lanza, A. F., 2018, A&A, 610, A81 [NASA ADS] [CrossRef] [EDP Sciences] [Google Scholar]
- Laughlin, G., Crismani, M., & Adams, F. C., 2011, ApJ, 729, L7 [NASA ADS] [CrossRef] [Google Scholar]
- Lecavelier Des Etangs, A., Ehrenreich, D., Vidal-Madjar, A., et al. 2010, A&A, 514, A72 [NASA ADS] [CrossRef] [EDP Sciences] [Google Scholar]
- Maggio, A., Pillitteri, I., Argiroffi, C., et al. 2024, A&A, 690, A383 [NASA ADS] [CrossRef] [EDP Sciences] [Google Scholar]
- Martioli, E., Hébrard, G., Correia, A. C. M., Laskar, J., & Lecavelier des Etangs, A. 2021, A&A, 649, A177 [NASA ADS] [CrossRef] [EDP Sciences] [Google Scholar]
- Melrose, D. B., & Dulk, G. A., 1982, ApJ, 259, 844 [Google Scholar]
- Offringa, A. R., McKinley, B., Hurley-Walker, N., et al. 2014, MNRAS, 444, 606 [Google Scholar]
- Osten, R. A., Hawley, S. L., Allred, J. C., Johns-Krull, C. M., & Roark, C., 2005, ApJ, 621, 398 [Google Scholar]
- Perley, R. A., Chandler, C. J., Butler, B. J., & Wrobel, J. M., 2011, ApJ, 739, L1 [Google Scholar]
- Pineda, J. S., & Villadsen, J., 2023, NatAs, 7, 569 [Google Scholar]
- Plavchan, P., Barclay, T., Gagné, J., et al. 2020, Nature, 582, 497 [Google Scholar]
- Pope, B. J. S., Callingham, J. R., Feinstein, A. D., et al. 2021, ApJ, 919, L10 [NASA ADS] [CrossRef] [Google Scholar]
- Poppenhaeger, K., & Schmitt, J. H. M. M., 2011, ApJ, 735, 59 [NASA ADS] [CrossRef] [Google Scholar]
- Pérez-Torres, M., Gómez, J. F., Ortiz, J. L., et al. 2021, A&A, 645, A77 [NASA ADS] [CrossRef] [EDP Sciences] [Google Scholar]
- Reiners, A., Shulyak, D., Kåpylå, P. J., et al. 2022, A&A, 662, A41 [NASA ADS] [CrossRef] [EDP Sciences] [Google Scholar]
- Ricker, G. R., Winn, J. N., Vanderspek, R., et al. 2015, J. Astron. Telesc. Instrum. Syst., 1, 014003 [Google Scholar]
- Rizzuto, A. C., Newton, E. R., Mann, A. W., et al. 2020, AJ, 160, 33 [Google Scholar]
- Saur, J., Grambusch, T., Duling, S., Neubauer, F. M., & Simon, S., 2013, A&A, 552, A119 [NASA ADS] [CrossRef] [EDP Sciences] [Google Scholar]
- Scharf, C. A., 2010, ApJ, 722, 1547 [NASA ADS] [CrossRef] [Google Scholar]
- Shkolnik, E. L., & Llama, J., 2018, Handbook of Exoplanets, Signatures of StarPlanet Interactions (Berlin: Springer International Publishing AG) [Google Scholar]
- Shkolnik, E., Bohlender, D. A., Walker, G. A. H., & Collier Cameron, A., 2008, ApJ, 676, 628 [NASA ADS] [CrossRef] [Google Scholar]
- Spake, J. J., Oklopčić, A., & Hillenbrand, L. A., 2021, AJ, 162, 284 [NASA ADS] [CrossRef] [Google Scholar]
- Strugarek, A., Fares, R., Bourrier, V., et al. 2022, MNRAS, 512, 4556 [NASA ADS] [CrossRef] [Google Scholar]
- Team, T. C., Bean, B., Bhatnagar, S., et al. 2022, PASP, 134, 114501 [NASA ADS] [CrossRef] [Google Scholar]
- Thao, P. C., Mann, A. W., Feinstein, A. D., et al. 2024, AJ, 168, 297 [Google Scholar]
- Tian, F., 2015, Annu. Rev. Earth Planet. Sci., 43, 459 [Google Scholar]
- Treumann, R. A., 2006, Astron. Astrophys. Rev., 13, 229 [NASA ADS] [CrossRef] [Google Scholar]
- Truemper, J., 1982, Adv. Space Res., 2, 241 [Google Scholar]
- Turner, J. D., Zarka, P., Grießmeier, J.-M., et al. 2021, A&A, 645, A59 [NASA ADS] [CrossRef] [EDP Sciences] [Google Scholar]
- Turner, J. D., Grießmeier, J.-M., Zarka, P., Zhang, X., & Mauduit, E., 2024, A&A, 688, A66 [NASA ADS] [CrossRef] [EDP Sciences] [Google Scholar]
- van Diepen, G., Dijkema, T. J., & Offringa, A., 2018, Astrophysics Source Code Library [record ascl:1804.003] [Google Scholar]
- Van Looveren, G., Güdel, M., Boro Saikia, S., & Kislyakova, K., 2024, A&A, 683, A153 [Google Scholar]
- Vedantham, H. K., Callingham, J. R., Shimwell, T. W., et al. 2020, NatAs, 4, 577 [Google Scholar]
- Williams, P. K. G., Cook, B. A., & Berger, E., 2014, ApJ, 785, 9 [Google Scholar]
- Wilson, W. E., Ferris, R. H., Axtens, P., et al. 2011, MNRAS, 416, 832 [Google Scholar]
- Yiu, T. W. H., Vedantham, H. K., Callingham, J. R., & Günther, M. N., 2024, A&A, 684, A3 [NASA ADS] [CrossRef] [EDP Sciences] [Google Scholar]
- Zarka, P., 2007, P&SS, 55, 598 [Google Scholar]
- Zarka, P., Treumann, R. A., Ryabov, B. P., & Ryabov, V. B., 2001, Astrophys. Space Sci., 277, 293 [NASA ADS] [CrossRef] [Google Scholar]
All Tables
All Figures
|
Fig. 1 Light curves of Stokes I flux density in the 1.1 – 3.1 GHz band of ATCA, with one panel for each observing run where HIP 67522 was detected. Gray arrows indicate non-detections, with arrow length corresponding to the 1 – σ RMS noise. |
| In the text | |
|
Fig. 2 ATCA Stokes I light curves from Fig. 1 folded with the orbital period of HIP 67522 b (transit midtime set to phase 0). Colored downward arrows indicate non-detections in a 1 h interval of a run with a significant source detection in the integrated image. Gray triangles indicate that the entire observing run yielded a non-detection. Dashed gray lines mark the quadratures of HIP 67522 b. The Stokes I emission does not show any variability in phase with the planet’s orbit. Error bars indicate 1 – σ RMS noise. |
| In the text | |
|
Fig. 3 Radio spectra of HIP 67522 (diamonds, same color-coding as in Fig. 2), along with power-law fits (lines). Fitting all spectra jointly, as shown here, yields a spectral index of ≈ 1.0. |
| In the text | |
|
Fig. 4 Dynamic spectrum of the June 11, 2024, radio burst. We omitted frequencies below 1.4 GHz, which were dominated by RFI. The burst mostly occupies higher frequencies, likely beyond the 3.1 GHz limit, and its spectrum shows a positive slope (right panel, see also Fig. 3). |
| In the text | |
|
Fig. A.1 HIP 67522 detected in Stokes I with ATCA during the June 11 burst (top panel), and in quiescence on June 19 (bottom panel). The bottom left oval indicates the beam in each panel. Contours represent the 3, 5, 7, and 9 RMS noise levels. |
| In the text | |
Current usage metrics show cumulative count of Article Views (full-text article views including HTML views, PDF and ePub downloads, according to the available data) and Abstracts Views on Vision4Press platform.
Data correspond to usage on the plateform after 2015. The current usage metrics is available 48-96 hours after online publication and is updated daily on week days.
Initial download of the metrics may take a while.