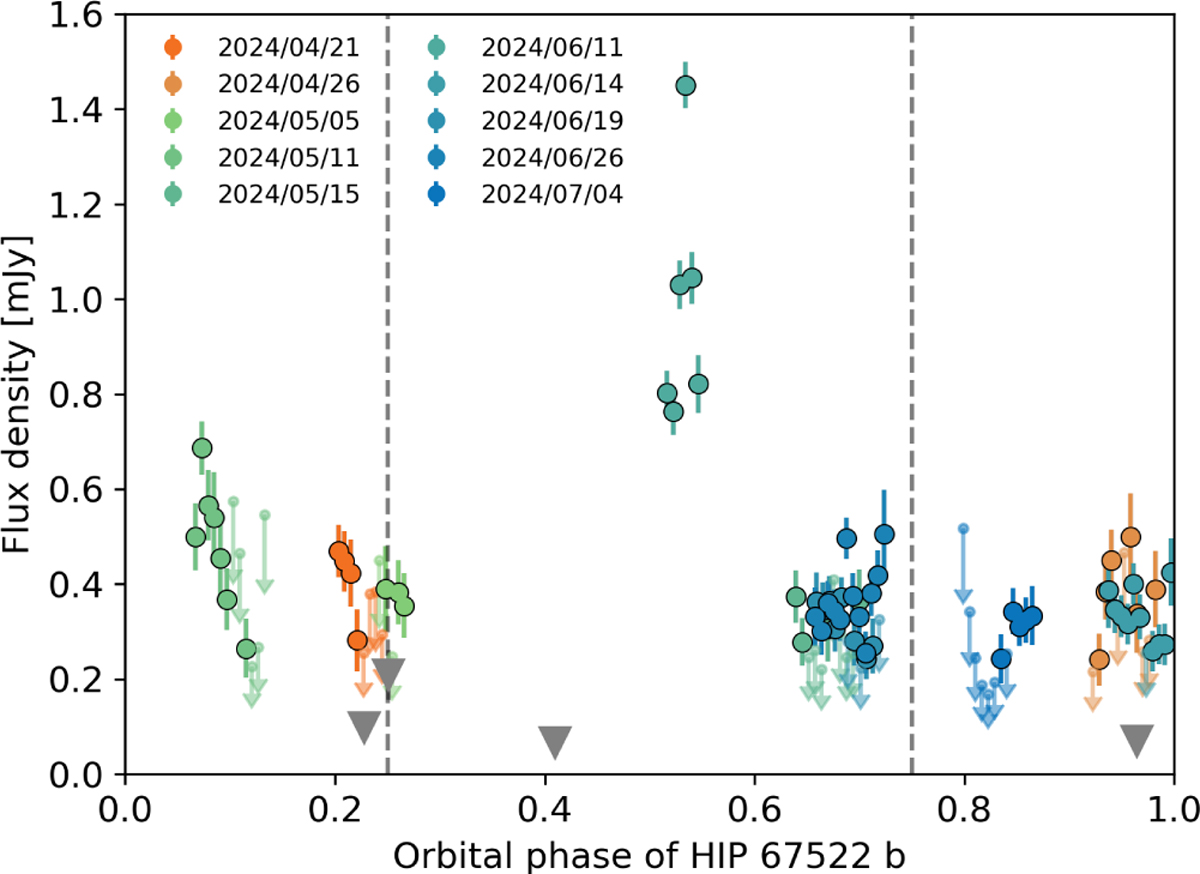
Fig. 2
Download original image
ATCA Stokes I light curves from Fig. 1 folded with the orbital period of HIP 67522 b (transit midtime set to phase 0). Colored downward arrows indicate non-detections in a 1 h interval of a run with a significant source detection in the integrated image. Gray triangles indicate that the entire observing run yielded a non-detection. Dashed gray lines mark the quadratures of HIP 67522 b. The Stokes I emission does not show any variability in phase with the planet’s orbit. Error bars indicate 1 – σ RMS noise.
Current usage metrics show cumulative count of Article Views (full-text article views including HTML views, PDF and ePub downloads, according to the available data) and Abstracts Views on Vision4Press platform.
Data correspond to usage on the plateform after 2015. The current usage metrics is available 48-96 hours after online publication and is updated daily on week days.
Initial download of the metrics may take a while.