| Issue |
A&A
Volume 699, July 2025
|
|
|---|---|---|
| Article Number | A62 | |
| Number of page(s) | 9 | |
| Section | Extragalactic astronomy | |
| DOI | https://doi.org/10.1051/0004-6361/202554491 | |
| Published online | 30 June 2025 | |
ALMA observation of an evolving magnetized corona in the radio-quiet changing-state active galactic nucleus NGC 1566
1
Instituto de Estudios Astrofísicos, Facultad de Ingeniería y Ciencias, Universidad Diego Portales, Av. Ejército Libertador 441, Santiago, Chile
2
Kavli Institute for Astronomy and Astrophysics, Peking University, Beijing 100871, People's Republic of China
3
Joint ALMA Observatory, Avenida Alonso de Cordova 3107, Vitacura 7630355, Santiago, Chile
4
Department of Earth and Space Science, Graduate School of Science, Osaka University, 1-1 Machikaneyama, Toyonaka, Osaka 560-0043, Japan
5
Interdisciplinary Theoretical & Mathematical Science Program (iTHEMS), RIKEN, 2-1 Hirosawa, 351-0198, Japan
6
Kavli Institute for the Physics and Mathematics of the Universe (WPI), UTIAS, The University of Tokyo, 5-1-5 Kashiwanoha, Kashiwa, Chiba 277-8583, Japan
7
RIKEN Cluster for Pioneering Research, 2-1 Hirosawa, Wako, Saitama, Saitama 351-0198, Japan
8
Instituto de Alta Investigación, Universidad de Tarapacá, Casilla 7D, Arica, Chile
9
School of Physics and Astronomy, Tel Aviv University, Tel Aviv 69978, Israel
10
Eureka Scientific, 2452 Delmer Street Suite 100, Oakland, CA 94602-3017, USA
11
Space Science Institute, 4750 Walnut Street, Suite 205, Boulder, Colorado 80301, USA
⋆ Corresponding author: arghajit.jana@mail.udp.cl
Received:
12
March
2025
Accepted:
19
May
2025
The origin of compact millimeter (mm) continuum emission from radio-quiet active galactic nuclei (RQAGNs) remains not fully understood. Changing-state AGNs (CSAGNs) exhibit rapid and strong variability, which allows us to investigate the origin of the mm emission. We present here the results of a first study of the mm continuum variability of a CSAGN using archival ALMA band 6 (∼230 GHz) observations of NGC 1566 obtained from 2014 to 2023. We find a positive correlation between the mm and X-ray flux with an intrinsic scatter of 0.05 dex (1σ), suggesting a common origin. The mm spectral index (αmm) is found to be in the range of 0.13±0.38 to −0.26±0.53, consistent with a compact optically thick synchrotron source. No significant correlation was found between the αmm and the mm flux. The mm/X-ray ratio also shows no clear link to the Eddington ratio but is higher in the low-accretion state. We discuss several scenarios about the origin of the mm emission in NGC 1566. We find that synchrotron emission in the magnetized X-ray corona appears to be the most probable origin of the mm emission, confirming that mm emission can be used as a tracer of AGN activity in RQAGNs.
Key words: accretion, accretion disks / galaxies: active / galaxies: nuclei / quasars: supermassive black holes / submillimeter: galaxies
© The Authors 2025
 Open Access article, published by EDP Sciences, under the terms of the Creative Commons Attribution License (https://creativecommons.org/licenses/by/4.0), which permits unrestricted use, distribution, and reproduction in any medium, provided the original work is properly cited.
This article is published in open access under the Subscribe to Open model. Subscribe to A&A to support open access publication.
1. Introduction
Active galactic nuclei (AGNs), powered by accretion onto supermassive black holes (SMBHs), are classified as radio-loud (RL) or radio-quiet (RQ) based on their radio emission (Begelman et al. 1984; Wilson & Colbert 1995). RLAGNs exhibit strong jet-driven radio emission, while RQAGNs show weaker, compact, and unresolved nuclear radio sources, potentially arising from processes such as outflows, compact jets, X-ray coronae, or star formation (SF; e.g., Padovani 2017; Panessa et al. 2019). Among these, the synchrotron emission from a magnetized X-ray corona as a source of radio emission is particularly intriguing (Field & Rogers 1993; Inoue & Doi 2018), as it may also explain the heating mechanisms of the corona, which remain debated (e.g., Beloborodov 2017, but see also Inoue et al. 2024; Hopkins 2024).
The X-ray corona is a compact region of the hot electron plasma near the SMBH, where UV seed photons are Compton upscattered to produce X-rays (Fabian et al. 2015; Haardt & Maraschi 1993; Chakrabarti & Titarchuk 1995). Magnetic reconnection is believed to be responsible for the coronal heating (Di Matteo et al. 1997; Merloni & Fabian 2001; Cheng et al. 2020), and such a magnetized corona would emit synchrotron radiation detectable in the millimeter (mm) regime (Di Matteo et al. 1997; Laor & Behar 2008; Inoue & Doi 2014). Theoretical models predict that the synchrotron emission peaks around ∼100 GHz and extends up to ∼300 GHz with a flat spectrum due to synchrotron self absorption (SSA; Inoue & Doi 2014; Raginski & Laor 2016; del Palacio et al. 2025). If the mm emission originates in the corona, we expect it to correlate strongly with X-ray emission.
Behar et al. (2015) found a possible mm/X-ray correlation in a sample of eight RQAGNs, though this correlation weakened in a larger sample of 34 sources with a large scatter of ∼0.5 dex (Behar et al. 2018). Kawamuro et al. (2022) observed a significant correlation between X-ray and 230 GHz emission while studying a sample of 98 AGNs with an intrinsic scatter of ∼0.34 dex. Ricci et al. (2023) found a tight correlation between the X-ray and 100 GHz emission with an intrinsic scatter of ∼0.22 dex using high-resolution ALMA data. To date, only a few studies have investigated the simultaneous mm/X-ray variability, revealing significant mm emission variability on a timescale of days (Baldi et al. 2015; Behar et al. 2020; Petrucci et al. 2023; Shablovinskaya et al. 2024). In NGC 7469, the mm emission varied by a factor of ∼2 over ∼4–5 days, while MCG +08-11-11 showed intraday mm variability (Petrucci et al. 2023). Additionally, Shablovinskaya et al. (2024) found that the mm emission in IC 4329A changed by a factor of ∼3 within four days, exceeding the variability of the X-rays in the same timescale (see also Michiyama et al. 2024, for the case of GRS 1734-292).
Changing-look AGNs (CLAGNs) switch between type 1 and type 2 states, with the appearance and disappearance of broad emission lines in the UV/optical spectra on a timescale of months to years (see Ricci & Trakhtenbrot 2023 for a recent review). These optical state transitions are mainly driven by changes in the accretion rate, and these CLAGNs are referred to as changing-state AGNs (CSAGNs) (Stern et al. 2018; Ricci & Trakhtenbrot 2023; Temple et al. 2023; Jana et al. 2025). The CS transitions are often accompanied by multiwavelength variability, including UV, optical, IR, and X-ray bands (MacLeod et al. 2016; Noda & Done 2018; Zeltyn et al. 2024).
The change in the accretion rate could occur in two possible ways: i) disk perturbations caused, for example, by a tidal disruption event (Merloni et al. 2015; Trakhtenbrot et al. 2019; Ricci et al. 2020); and ii) local disk instabilities (Stern et al. 2018; Noda & Done 2018). The latter scenario seems to be the most common (e.g., Ricci & Trakhtenbrot 2023; Jana et al. 2025), and during these CS transitions, the geometry of the inner accretion flow is also expected to change (Noda & Done 2018; Ruan et al. 2019). In the type 1 state, the disk extends to the inner most stable circular orbit, while, in the type 2 state, the disk recedes, whereby the inner accretion disk is replaced by a radiatively inefficient accretion flow (RIAF) or an extended X-ray corona (Chakrabarti & Titarchuk 1995; Reis & Miller 2013; Yuan & Narayan 2014).
During the CS transitions, the physical properties of the X-ray corona, such as its geometry, temperature, and electron density, are expected to evolve (Noda & Done 2018; Ruan et al. 2019). If the mm emission originates from the corona, it too may vary as the AGN changes spectral state. Therefore, CSAGNs provide a unique opportunity to investigate the origin of the mm emission and its relation to the accretion state.
NGC 1566, a nearby (z = 0.005) CSAGN, located at a distance of 17.9 Mpc (Koss et al. 2022), is an ideal source to investigate the origin of mm emission variability. This source has shown rapid multiwavelength variability over decades (Alloin et al. 1986; Baribaud et al. 1992). In 2018, it underwent an outburst, transitioning to a type 1 state with the appearance of broad optical lines, before fading back to a type 2 state in 2020 (Oknyansky et al. 2021; Ochmann et al. 2024).
NGC 1566 was observed in the radio band (∼1.4 GHz) in the past by ASKAP and ATCA, but at a relatively low resolution (with a beam size of ∼42″×35″; e.g., Ehle et al. 1996; Elagali et al. 2019). However, these observations are not relevant to studying the nuclear mm emission. In this work, we present the first study of mm and X-ray variability in a CSAGN, NGC 1566, using archival high-resolution ALMA Band 6 (∼230 GHz) data spanning from 2014 to 2023. We investigate the variability and origin of the mm emission and its relation to the accretion state.
The paper is organized as follows: In Section 2, we present the data analysis process. In Section 3, we present our results and discuss our findings. Lastly, in Section 4, we summarize our results. Throughout the paper, we adopt Λ-CDM cosmology with H0 = 70 km s−1 Mpc −1, Ωm = 0.3, and ΩΛ = 0.7. At z = 0.005; this cosmology implies an angular scale of 0.087 kpc/arcsec.
2. Observation and data analysis
ALMA observed NGC 1566 in Band 6 (230 GHz) across eight epochs between 2014 and 2023. The data were processed using CASA version 6.5.4.9 and the ALMA Pipeline version 2020.1.0.40 (Hunter et al. 2023, please see Appendix C for details of ALMA data analysis). For our analysis, we only considered the channels with continuum emissions. The central source was detected at various significance levels, with a signal-to-noise ratio ranging from 100 to 700, with a position consistent with the nominal nucleus of the galaxy. Based on a Gaussian 2D fit, the central emission appears unresolved at all resolutions probed (beam sizes ranging from 0.2″ to 7.3″, corresponding to physical scales of ∼20−640 pc). We included an error of 10% in all data, as recommended in the ALMA proposer's guide. An in-band spectral index (αmm) was derived from flux measurements in four spectral windows, following Fν∝ναmm. Details of the observations are summarized in Table A.1. Figure 1 shows the ALMA band 6 image of the source, obtained on June 14, 2022.
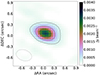 |
Fig. 1. ALMA image of NGC 1566 in band 6 at 230 GHz, observed on 2022-06-14. The synthesized beam size (gray ellipse at the lower corner) is |

The 14−150 keV X-ray fluxes were obtained from the 14−195 keV or 15−50 keV Swift/BAT count rate, or 2−10 keV Swift/XRT fluxes. For the period from 2004 to 2017, the 14−195 keV count rate was obtained from the 157-month catalog1. From 2018 onward, the 15−50 keV light curve was recovered from the BAT Hard X-ray transient monitor2. The 2−10 keV fluxes were obtained from the spectral analysis of 0.5−10 keV Swift/XRT observations. These count rates and fluxes were converted to 14−150 keV fluxes, assuming a power-law spectrum with Γ = 1.8 (Ricci et al. 2017).
The bolometric luminosity (Lbol) was calculated using the Eddington ratio- (λEdd) dependent bolometric correction factors (κ14−195 keV) of Gupta et al. (2024). According to this recent study, the bolometric correction factor is given by log κ14−195=(0.13±0.04)log λEdd+(1.04±0.05).
3. Results and discussions
3.1. Light curves
NGC 1566 showed an outburst in June 2018, when the fluxes in the optical, UV, IR, and X-ray bands increased, and the source moved from a type 1.9 to a type 1 spectral state (Oknyansky et al. 2019, 2020; Parker et al. 2019; Tripathi & Dewangan 2022). Figure 2 shows the light curves of NGC 1566 in 14−150 keV (Swift/BAT), 2−10 keV (Swift/XRT), and 230 GHz (ALMA) in the top, middle, and bottom panels, respectively, spanning the years 2014–2023.
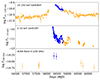 |
Fig. 2. Light curves of NGC 1566. Top panel: Swift/BAT flux (14−150 keV; F14−150 keV). Middle panel: Swift/XRT flux (F2−10 keV; 2−10 keV). Bottom panel: ALMA band 6 flux (230 GHz; F230 GHz). The F14−150 keV, F2−10 keV, and F230 GHz are given in units of erg cm−2 s−1. The blue circles and orange diamonds represent the data from type 1 and type 2 states, respectively. The Swift/BAT data are obtained from the BAT 157-month catalog and the BAT hard X-ray transient monitor for two periods, until 2017 and after 2018, respectively. Due to unavailability of the data, there is a gap between January 2018 and December 2018 in the Swift/BAT light curve. The BAT data are binned over 30 days, while the XRT data correspond to single exposures. |
The 2−10 keV X-ray and UVW2 flux increased approximately ∼25−30 times during the outburst (Oknyansky et al. 2020; Jana et al. 2021). In the optical band, the G-band flux increased approximately ∼25% compared to the pre-outburst phase (Kollatschny & Chelouche 2024). The flux also increased in the mid-infrared (MIR) band, where the fluxes in the W1 and W2 bands increased ∼2.5 and ∼4 times, respectively (see Appendix B). At this time, the mm flux was also observed to increase by a factor of ∼2, reaching ∼9.8±1.0 mJy. Later, in 2023, the mm flux decreased to ∼3.5±0.4 mJy when the fluxes in other wavebands also decreased. Overall, we found that the mm continuum emission varies together with all the other bands during the CS event.
3.2. Relation between mm and X-ray emissions
Figure 3 displays the relation of the mm continuum flux at 230 GHz (F230 GHz) with the X-ray continuum flux at 14−150 keV (F14−150 keV). We find a possible positive correlation between F230 GHz and F14−150 keV with a Spearman correlation index of 0.54 and a p-value of 0.0168. A linear fit in logarithmic space yields log F230 GHz=(0.39±0.13)log F14−150 keV+(−10.62±1.34), with an intrinsic scatter of 0.05 dex (1σ level). While studying the relation between log L230 GHz and log L14−150 keV for 98 RQAGNs, Kawamuro et al. (2022) found a steeper slope, ∼1.19±0.08, with a scatter of 0.30 dex. Similarly, Ricci et al. (2023) observed a slope of 1.22±0.02 and an intrinsic scatter of 0.22 dex for the 100 GHz mm emission (L100 GHz) and 14−150 keV X-ray flux in RQAGNs. Some portion of the scatter in the latter two studies could be attributed to nonsimultaneous observations. The observed flatter slope in the current study could be attributed to the extended or constant emission contaminating the weaker flux measurement.
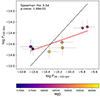 |
Fig. 3. Variation of the mm flux at 230 GHz (F230 GHz) as a function of the 14–150 keV X-ray flux (F14−150 keV). The solid red line represents the best-fit. The dashed black line represents the F230 GHz−F14−150 keV relation from Kawamuro et al. (2022). |
Figure 4 shows the relation between F230 GHz/F14−150 keV and λEdd. The median of the ratio between the mm and the X-ray flux is found to be log(F230 GHz/F14−150 keV) = −4.42±0.21. This result is consistent with the previous study of Kawamuro et al. (2022). The ratio is found to be somewhat higher at low λEdd: for λEdd<10−2, the median ratio is found to be −4.01±0.22, while for λEdd>10−2 it is −4.52±0.20.
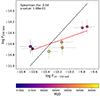 |
Fig. 4. Variation of the ratio of the mm flux to the X-ray flux as a function of Eddington ratio. The horizontal dashed line represents the ratio of the mm flux to the X-ray flux from Kawamuro et al. (2022). |
We did not observe any correlation between αmm and the F230 GHz (Figure 5). NGC 1566 generally showed a flat slope ranging between −0.3±0.5 and 0.1±0.4, which indicates a compact and optically thick source of mm emission (Rybicki & Lightman 1979).
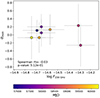 |
Fig. 5. Variation of the in-band spectral index (αmm) as a function of 230 GHz flux (F230 GHz). The solid red line indicates the best fit. |
3.3. Origin of the mm emission
3.3.1. Star formation and dust
Nuclear SF can contribute to the mm emission through mechanisms such as free-free emission from H II regions, synchrotron radiation from cosmic rays, or thermal dust emission (Condon 1992; Tabatabaei et al. 2017). The nuclear (<1″) SF rate of NGC 1566 is estimated to be 5.3×10⁻³ M⊙ yr−1 (Smajić et al. 2015). We estimated the contribution of SF to the mm emission at 230 GHz due to the free-free and synchrotron emission using Equation (3) of Kawamuro et al. (2022). We obtained  erg s−1 (≈0.07 μJy), which is four orders of magnitude lower than the observed mm emission.
Thermal dust emission typically produces a steep spectral index (αmm∼3.5; Mullaney et al. 2011), which is inconsistent with the flat slope (−0.26 to 0.13) observed in NGC 1566. Furthermore, dust emission dominates at higher frequencies (ν>300 GHz), making it unlikely to contribute significantly at 230 GHz (Barvainis et al. 1992; Hughes et al. 1993; Draine & Li 2007; Baskin & Laor 2021). At ∼230 GHz, the expected free-free emission would be ∼1 mJy, which is a few times less than the observed flux (Baskin & Laor 2021). Additionally, the free-free emission from a dusty torus and SF would not exhibit variability on the observed timescales (Baskin & Laor 2021).
3.3.2. Compact jet
A sub-parsec-scale unresolved jet could, in principle, contribute to the mm emission observed in NGC 1566 (e.g., Panessa et al. 2019). Compact jets are well studied in black hole X-ray binaries (BHXBs), where their presence and evolution are strongly tied to the accretion state of the system (Corbel et al. 2000; Fender & Belloni 2004; Russell et al. 2015; Tetarenko et al. 2021). In BHXBs, a steady, compact jet produces strong radio emission during the low-hard state, whereas in the high-soft state, the jet weakens, leading to a significant drop in radio flux (Fender & Belloni 2004; Jana et al. 2017; Tremou et al. 2020).
NGC 1566 is a CSAGN, which showed dramatic spectral transitions. The CSAGNs often show striking similarities in the spectral and timing properties with the BHXBs (Noda & Done 2018; Ruan et al. 2019; Jana et al. 2021). If a similar disk-jet coupling remains the same in CSAGNs, one would expect a decline in the jet-related mm emission during high-accretion states, mirroring the behavior seen in BHXBs. However, in NGC 1566, the mm flux increases with the accretion activity, contradicting this expectation. This indicates that compact jets are unlikely to be the primary contributor to the mm emission of NGC 1566.
3.3.3. Outflow-driven shock
The AGN outflows can collide with the surrounding interstellar medium and produce shocks. The shock accelerates electrons, which in turn produce synchrotron emission (e.g., Hwang et al. 2018; Liao et al. 2024). It has been suggested that the ratio of synchrotron to AGN bolometric flux would be ∼10−5−10−6, if ∼0.5−5% of the bolometric luminosity is converted into the kinetic energy, in which case ∼1% of the outflow energy is used to produce relativistic particles that radiate the synchrotron emission (Nims et al. 2015). In this case, the radio emission is expected to arise from a region on the order of several hundred pc (Yamada et al. 2024).
Interestingly, we found a similar ratio between the mm and bolometric flux (F230 GHz∼10−5Fbol) in NGC 1566. NGC 1566 showed X-ray wind with velocity, vout∼500 km s−1, in the high accretion state (Parker et al. 2019). Conservatively assuming the outflow velocity as the escape velocity, we estimated the location of the outflow as >7×1014 cm ∼2×10⁻⁴ pc. The mass outflow rate can be estimated using  (Krongold et al. 2007), where Ω is the covering factor of the wind and ne is the electron density. Substituting, NH=nR in the above equation, we obtained
  , where NH∼2.5×1020 cm−2 (Parker et al. 2019). We estimated a conservative value of the mass outflow rate as
  g s−1. This would correspond to a kinetic energy of
  erg s−1, which translates to a flux of ∼2 μJy at 230 GHz. This is lower by several orders than the observed continuum mm emission in NGC 1566.
3.3.4. Synchrotron emission in the X-ray corona
A magnetized X-ray corona, heated by magnetic reconnection, can naturally produce mm emission via synchrotron radiation from relativistic nonthermal electrons (Di Matteo et al. 1997; Fabian et al. 2002; Laor & Behar 2008; Inoue & Doi 2014; Raginski & Laor 2016). The observed tight correlation between the mm and X-ray flux suggests that the mm and X-ray emission could be coupled and originate in a similar region (Kawamuro et al. 2022; Ricci et al. 2023).
We find no correlation between αmm and F230 GHz, which is consistent with and in agreement with the findings of Kawamuro et al. (2022). The observed αmm suggests that the mm emission originates in an optically thick region. We calculated the size of the self-absorbed synchrotron source as Rmm∼4−7×10⁻⁵ pc or ∼100−200 Rg, assuming that the magnetic energy density is in equipartition with the photon energy density and using Equation (22) of Laor & Behar (2008). The equipartition magnetic field (Beq) is found in the range ∼100−300 G, which is higher than the typical values of magnetic fields (e.g., Inoue & Doi 2018). Considering a magnetic field B = 10 G, as seen in IC 4329A (Inoue & Doi 2018, see also Inoue et al. 2020; Michiyama et al. 2023), the size of the mm-emitting source would be ∼50−100 Rg. The size of the X-ray corona (RX) is estimated to be RX∼20−40 Rg from the broadband X-ray spectral study of NGC 1566 (Jana et al. 2021), using the OPTXAGNF model (Done et al. 2012). This indicates that the radio sphere may coincide with the X-ray corona or be slightly extended. Considering RX=Rmm, we estimated the magnetic field in the range of ∼0.1−1 G. This is similar to the magnetic field found in the lensed quasar RXJ J1131–1231, where the mm-emitting region is constrained to be <46 Rg (Rybak et al. 2025). Recently, del Palacio et al. (2025) constructed a radio-to-far infrared SED model for coronal mm emissions to constrain the magnetic field and coronal size. By applying their model to seven RQAGNs, the authors found B in the range of ∼10−150 G, which is higher than our simple estimation. This suggests that a detailed SED modeling is required to constrain the magnetic field in NGC 1566.
The enhancement of the mm flux compared to the X-ray flux at low Eddington ratios (see Fig. 4) can be attributed to two mechanisms: an increase in the nonthermal electron population or a strengthening of the magnetic field (Inoue & Doi 2014). The observed constant spectral index (αmm, Fig. 5) indicates minimal change in the electron energy distribution, suggesting that cooling effects are insignificant. This stability in αmm makes substantial magnetic field variations unlikely. The observed possible anticorrelation of the mm to X-ray emission ratio with λEdd (Fig. 4) provides an interesting insight. Lower λEdd, which implies lower accretion densities, correspond to higher mm fluxes. This can be explained by the density dependence of particle acceleration efficiency-in lower-density flows, particles are more easily accelerated to nonthermal energies. Consequently, this could lead to a larger nonthermal electron population and enhanced mm emission. Further dense light curve datasets would test this scenario.
3.4. Implication of the mm emission in NGC 1566
NGC 1566 underwent an outburst in 2018, transitioning to the type 1 state from the type 2 state (Oknyansky et al. 2019; Ochmann et al. 2024). Later in 2020, the source moved back to the type 2 state with the fluxes decreasing in all wavebands (Xu et al. 2024). The change in the accretion rate drives the CS transition in this source (Jana et al. 2021, 2025). The X-ray flux, which is considered to be a tracer of the accretion rate in AGN, is found to correlate with the UV, optical, and MIR emission (Oknyansky et al. 2019, 2020). The mm emission is also found to follow a similar trend as the UV, optical, MIR, and X-ray emission. The tight correlation between the X-ray and mm emission in NGC 1566 suggests a strong link between the mm emission and accretion activity.
A simple estimation indicates that the free-free emission from dust could contribute up to ∼1 mJy at ∼230 GHz in NGC 1566, making this contribution non-negligible (see Section 3.3.1). Despite this potential contamination, various correlations between the mm and X-ray emission indicate that the X-ray corona remains the dominant source of the mm emission in NGC 1566. Our results confirm the idea that the mm emission can be used as a tracer of AGN activity in RQAGNs (see also, Kawamuro et al. 2022; Ricci et al. 2023).
4. Summary and conclusions
In this study, we investigated the mm emission variability of the CSAGN for the first time, providing new insights into its nature. Here, we studied NGC 1566 using archival high-resolution ( ) ALMA observations in Band 6 (∼230 GHz) taken in eight different epochs between 2014 and 2023. Our findings are the following:
-
We observe a strong correlation between the mm and X-ray emission with an intrinsic scatter of 0.05 dex (1σ), which suggests that they are energetically coupled and likely originate in a similar physical region.
-
We discuss several possible physical mechanisms that could be responsible for the bulk of the mm continuum emission in NGC 1566. We discard SF, outflow-driven shock, and compact jet as possible contributors to the mm emission. The free-free emission from dust could contribute up to ∼1 mJy in the mm wavebands; however, this would be non-variable. Despite this, the X-ray corona is found to be a dominant contributor to the nuclear mm emission.
-
We do not observe any significant correlation between αmm and F230 GHz, despite seeing a possible negative trend. The observed αmm suggests that the mm emission arises from a compact, optically thick radio sphere, which could coincide with the X-ray corona.
-
The median of log(F230 GHz/F14−150 keV) is found to be −4.42±0.21. While no strong correlation is found between the flux ratio and λEdd, the ratio appears higher in the low-accretion state. This could be due to more efficient particle acceleration in low-density flows. This results in a larger nonthermal electron population and enhanced mm emission compared to the X-ray emission.
-
The mm emission follows a similar trend as the X-ray, UV, optical, and MIR wavebands. Along with the strong mm to X-ray correlation, this suggests a close connection between the mm emission and the accretion rate. These findings support the use of mm emission as a tracer of accretion activity in RQAGNs.
Our findings indicate that the compact X-ray corona is the most probable source of mm-wave emission in NGC 1566. Future studies will focus on observing the source across different accretion states using simultaneous multiwavelength data, including radio, mm, optical, and X-ray bands. Long-term monitoring campaigns in the mm-wave band will be crucial for capturing transient phenomena and understanding the connection between mm-wave emission and changes in the accretion flow. It will also help us understand the radio emission in RQAGNs, as well as the heating mechanism of the X-ray corona.
Acknowledgments
We thank the reviewer E. Behar for his invaluable comments and suggestions that improved the paper significantly. We acknowledge support from ANID grants FONDECYT Postdoctoral fellowship 3230303 (AJ), Fondecyt Regular grant 1230345 (CR) and 1241005 (FEB), ANID BASAL project FB210003 (CR, FEB), the China-Chile joint research fund (CR), and the Millennium Science Initiative, AIM23-0001 (FEB). YI is supported by NAOJ ALMA Scientific Research Grant Number 2021-17A; JSPS KAKENHI Grant Number JP22K18277; and World Premier International Research Center Initiative (WPI), MEXT, Japan. TK is supported by JSPS KAKENHI 23K13153. BT is supported by the European Research Council (ERC) under the European Union's Horizon 2020 research and innovation program (grant agreement number 950533). This paper makes use of the following ALMA data: ADS/JAO.ALMA#2012.1.00474.S, ADS/JAO.ALMA#2015.1.00925.S, ADS/JAO.ALMA#2017.1.00392.S, ADS/JAO.ALMA#2018.1.01651.5, ADS/JAO.ALMA#2021.1.01150.S, ADS/JAO.ALMA#2023.1.01182.S. ALMA is a partnership of ESO (representing its member states), NSF (USA) and NINS (Japan), together with NRC (Canada), NSTC and ASIAA (Taiwan), and KASI (Republic of Korea), in cooperation with the Republic of Chile. The Joint ALMA Observatory is operated by ESO, AUI/NRAO and NAOJ.
References
- Alloin, D., Pelat, D., Phillips, M. M., Fosbury, R. A. E., & Freeman, K. 1986, ApJ, 308, 23 [NASA ADS] [CrossRef] [Google Scholar]
- Baldi, R. D., Behar, E., Laor, A., & Horesh, A. 2015, MNRAS, 454, 4277 [Google Scholar]
- Baribaud, T., Alloin, D., Glass, I., & Pelat, D. 1992, A&A, 256, 375 [NASA ADS] [Google Scholar]
- Barvainis, R., Antonucci, R., & Coleman, P. 1992, ApJ, 399, L19 [CrossRef] [Google Scholar]
- Baskin, A., & Laor, A. 2021, MNRAS, 508, 680 [NASA ADS] [CrossRef] [Google Scholar]
- Begelman, M. C., Blandford, R. D., & Rees, M. J. 1984, Rev. Mod. Phys., 56, 255 [Google Scholar]
- Behar, E., Baldi, R. D., Laor, A., et al. 2015, MNRAS, 451, 517 [NASA ADS] [CrossRef] [Google Scholar]
- Behar, E., Vogel, S., Baldi, R. D., Smith, K. L., & Mushotzky, R. F. 2018, MNRAS, 478, 399 [CrossRef] [Google Scholar]
- Behar, E., Kaspi, S., Paubert, G., et al. 2020, MNRAS, 491, 3523 [NASA ADS] [CrossRef] [Google Scholar]
- Beloborodov, A. M. 2017, ApJ, 850, 141 [NASA ADS] [CrossRef] [Google Scholar]
- Chakrabarti, S., & Titarchuk, L. G. 1995, ApJ, 455, 623 [NASA ADS] [CrossRef] [Google Scholar]
- Cheng, H., Liu, B. F., Liu, J., et al. 2020, MNRAS, 495, 1158 [CrossRef] [Google Scholar]
- Condon, J. J. 1992, ARA&A, 30, 575 [Google Scholar]
- Corbel, S., Fender, R. P., Tzioumis, A. K., et al. 2000, A&A, 359, 251 [NASA ADS] [Google Scholar]
- del Palacio, S., Yang, C., Aalto, S., et al. 2025, A&A, submitted [arXiv:2504.07762] [Google Scholar]
- Di Matteo, T., Celotti, A., & Fabian, A. C. 1997, MNRAS, 291, 805 [Google Scholar]
- Done, C., Davis, S. W., Jin, C., Blaes, O., & Ward, M. 2012, MNRAS, 420, 1848 [Google Scholar]
- Draine, B. T., & Li, A. 2007, ApJ, 657, 810 [CrossRef] [Google Scholar]
- Ehle, M., Beck, R., Haynes, R. F., et al. 1996, A&A, 306, 73 [NASA ADS] [Google Scholar]
- Elagali, A., Staveley-Smith, L., Rhee, J., et al. 2019, MNRAS, 487, 2797 [NASA ADS] [CrossRef] [Google Scholar]
- Evans, P. A., Beardmore, A. P., Page, K. L., et al. 2009, MNRAS, 397, 1177 [Google Scholar]
- Fabian, A. C., Ballantyne, D. R., Merloni, A., et al. 2002, MNRAS, 331, L35 [Google Scholar]
- Fabian, A. C., Lohfink, A., Kara, E., et al. 2015, MNRAS, 451, 4375 [Google Scholar]
- Fender, R., & Belloni, T. 2004, ARA&A, 42, 317 [NASA ADS] [CrossRef] [Google Scholar]
- Field, G. B., & Rogers, R. D. 1993, ApJ, 403, 94 [NASA ADS] [CrossRef] [Google Scholar]
- Gupta, K. K., Ricci, C., Temple, M. J., et al. 2024, A&A, 691, A203 [NASA ADS] [CrossRef] [EDP Sciences] [Google Scholar]
- Haardt, F., & Maraschi, L. 1993, ApJ, 413, 507 [Google Scholar]
- Hopkins, P. F. 2024, Open J. Astrophys., 8, 56 [Google Scholar]
- Hughes, D. H., Robson, E. I., Dunlop, J. S., & Gear, W. K. 1993, MNRAS, 263, 607 [Google Scholar]
- Hunter, T. R., Indebetouw, R., Brogan, C. L., et al. 2023, PASP, 135, 074501 [NASA ADS] [CrossRef] [Google Scholar]
- Hwang, H. -C., Zakamska, N. L., Alexandroff, R. M., et al. 2018, MNRAS, 477, 830 [CrossRef] [Google Scholar]
- Inoue, Y., & Doi, A. 2014, PASJ, 66, L8 [NASA ADS] [CrossRef] [Google Scholar]
- Inoue, Y., & Doi, A. 2018, ApJ, 869, 114 [Google Scholar]
- Inoue, Y., Khangulyan, D., & Doi, A. 2020, ApJ, 891, L33 [Google Scholar]
- Inoue, Y., Takasao, S., & Khangulyan, D. 2024, PASJ, 76, 996 [Google Scholar]
- Jana, A., Chakrabarti, S. K., & Debnath, D. 2017, ApJ, 850, 91 [NASA ADS] [CrossRef] [Google Scholar]
- Jana, A., Kumari, N., Nandi, P., et al. 2021, MNRAS, 507, 687 [NASA ADS] [CrossRef] [Google Scholar]
- Jana, A., Ricci, C., Temple, M. J., et al. 2025, A&A, 693, A35 [NASA ADS] [CrossRef] [EDP Sciences] [Google Scholar]
- Kawamuro, T., Ricci, C., Imanishi, M., et al. 2022, ApJ, 938, 87 [NASA ADS] [CrossRef] [Google Scholar]
- Kollatschny, W., & Chelouche, D. 2024, A&A, 690, L2 [NASA ADS] [CrossRef] [EDP Sciences] [Google Scholar]
- Koss, M. J., Ricci, C., Trakhtenbrot, B., et al. 2022, ApJS, 261, 2 [NASA ADS] [CrossRef] [Google Scholar]
- Krongold, Y., Nicastro, F., Elvis, M., et al. 2007, ApJ, 659, 1022 [NASA ADS] [CrossRef] [Google Scholar]
- Laor, A., & Behar, E. 2008, MNRAS, 390, 847 [NASA ADS] [CrossRef] [Google Scholar]
- Liao, M., Wang, J., Ren, W., & Zhou, M. 2024, MNRAS, 528, 3696 [NASA ADS] [CrossRef] [Google Scholar]
- MacLeod, C. L., Ross, N. P., Lawrence, A., et al. 2016, MNRAS, 457, 389 [Google Scholar]
- Merloni, A., & Fabian, A. C. 2001, MNRAS, 321, 549 [NASA ADS] [CrossRef] [Google Scholar]
- Merloni, A., Dwelly, T., Salvato, M., et al. 2015, MNRAS, 452, 69 [Google Scholar]
- Michiyama, T., Inoue, Y., & Doi, A. 2023, PASJ, 75, 874 [Google Scholar]
- Michiyama, T., Inoue, Y., Doi, A., et al. 2024, ApJ, 965, 68 [NASA ADS] [CrossRef] [Google Scholar]
- Mullaney, J. R., Alexander, D. M., Goulding, A. D., & Hickox, R. C. 2011, MNRAS, 414, 1082 [Google Scholar]
- Nims, J., Quataert, E., & Faucher-Giguère, C. -A. 2015, MNRAS, 447, 3612 [NASA ADS] [CrossRef] [Google Scholar]
- Noda, H., & Done, C. 2018, MNRAS, 480, 3898 [Google Scholar]
- Ochmann, M. W., Kollatschny, W., Probst, M. A., et al. 2024, A&A, 686, A17 [NASA ADS] [CrossRef] [EDP Sciences] [Google Scholar]
- Oknyansky, V. L., Winkler, H., Tsygankov, S. S., et al. 2019, MNRAS, 483, 558 [NASA ADS] [CrossRef] [Google Scholar]
- Oknyansky, V. L., Winkler, H., Tsygankov, S. S., et al. 2020, MNRAS, 498, 718 [NASA ADS] [CrossRef] [Google Scholar]
- Oknyansky, V. L., Brotherton, M. S., Tsygankov, S. S., et al. 2021, MNRAS, 505, 1029 [NASA ADS] [CrossRef] [Google Scholar]
- Padovani, P. 2017, Nat. Astron., 1, 0194 [Google Scholar]
- Panessa, F., Baldi, R. D., Laor, A., et al. 2019, Nat. Astron., 3, 387 [Google Scholar]
- Parker, M. L., Schartel, N., Grupe, D., et al. 2019, MNRAS, 483, L88 [NASA ADS] [CrossRef] [Google Scholar]
- Petrucci, P. O., Piétu, V., Behar, E., et al. 2023, A&A, 678, L4 [NASA ADS] [CrossRef] [EDP Sciences] [Google Scholar]
- Raginski, I., & Laor, A. 2016, MNRAS, 459, 2082 [CrossRef] [Google Scholar]
- Reis, R. C., & Miller, J. M. 2013, ApJ, 769, L7 [NASA ADS] [CrossRef] [Google Scholar]
- Ricci, C., & Trakhtenbrot, B. 2023, Nat. Astron., 7, 1282 [Google Scholar]
- Ricci, C., Trakhtenbrot, B., Koss, M. J., et al. 2017, ApJS, 233, 17 [Google Scholar]
- Ricci, C., Kara, E., Loewenstein, M., et al. 2020, ApJ, 898, L1 [Google Scholar]
- Ricci, C., Chang, C. -S., Kawamuro, T., et al. 2023, ApJ, 952, L28 [NASA ADS] [CrossRef] [Google Scholar]
- Ruan, J. J., Anderson, S. F., Eracleous, M., et al. 2019, ApJ, 883, 76 [NASA ADS] [CrossRef] [Google Scholar]
- Russell, T. D., Miller-Jones, J. C. A., Curran, P. A., et al. 2015, MNRAS, 450, 1745 [Google Scholar]
- Rybak, M., Sluse, D., Gupta, K. K., et al. 2025, A&A, submitted [arXiv:2503.13313] [Google Scholar]
- Rybicki, G. B., & Lightman, A. P. 1979, Radiative Processes in Astrophysics (New York: Wiley) [Google Scholar]
- Shablovinskaya, E., Ricci, C., Chang, C. S., et al. 2024, A&A, 690, A232 [NASA ADS] [CrossRef] [EDP Sciences] [Google Scholar]
- Smajić, S., Moser, L., Eckart, A., et al. 2015, A&A, 583, A104 [NASA ADS] [CrossRef] [EDP Sciences] [Google Scholar]
- Stern, D., McKernan, B., Graham, M. J., et al. 2018, ApJ, 864, 27 [Google Scholar]
- Tabatabaei, F. S., Schinnerer, E., Krause, M., et al. 2017, ApJ, 836, 185 [Google Scholar]
- Temple, M. J., Ricci, C., Koss, M. J., et al. 2023, MNRAS, 518, 2938 [Google Scholar]
- Tetarenko, A. J., Casella, P., Miller-Jones, J. C. A., et al. 2021, MNRAS, 504, 3862 [NASA ADS] [CrossRef] [Google Scholar]
- Trakhtenbrot, B., Arcavi, I., MacLeod, C. L., et al. 2019, ApJ, 883, 94 [Google Scholar]
- Tremou, E., Corbel, S., Fender, R. P., et al. 2020, MNRAS, 493, L132 [NASA ADS] [CrossRef] [Google Scholar]
- Tripathi, P., & Dewangan, G. C. 2022, ApJ, 930, 117 [NASA ADS] [CrossRef] [Google Scholar]
- Wilson, A. S., & Colbert, E. J. M. 1995, ApJ, 438, 62 [NASA ADS] [CrossRef] [Google Scholar]
- Xu, D. W., Komossa, S., Grupe, D., et al. 2024, Universe, 10, 61 [NASA ADS] [CrossRef] [Google Scholar]
- Yamada, T., Sakai, N., Inoue, Y., & Michiyama, T. 2024, ApJ, 968, 116 [Google Scholar]
- Yuan, F., & Narayan, R. 2014, ARA&A, 52, 529 [NASA ADS] [CrossRef] [Google Scholar]
- Zeltyn, G., Trakhtenbrot, B., Eracleous, M., et al. 2024, ApJ, 966, 85 [NASA ADS] [CrossRef] [Google Scholar]
Appendix A: Observation log
Details of the ALMA Observations
Important physical parameters
Appendix B: Multiwavelength observations
The Swift/UVW2 photometric flux was estimated using UVOTSOURCE task. The AGN flux was estimated by subtracting the host galaxy contribution in the UVW2 band. The host galaxy flux was taken from the AGN SED study of Gupta et al. (2024). We obtained MIR light curves from WISE in W1 (3.4 μm) and W2 (4.6 μm) band from IPAC. We also obtained optical light curves in G and V band from ASSAS-Sn archive3. Figure B.1 shows the light curve in UVW2, optical (v and g-band) and MIR wavebands.
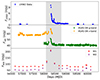 |
Fig. B.1. Light curves of NGC 1566. Top panel: UV flux from Swift/UVOT in UVW2 band (FUVW2). Middle panel: Optical flux (Fopt) from ASSAS-Sn. The orange diamonds and green circles represent the light curve in the V and G band, respectively. Bottom panel: MIR fluxes (FMIR), obtained from WISE and NEO-WISE. The red circles and purple diamonds represent the light curve in W1 and W2 bands, respectively. |
Appendix C: ALMA data reduction
We utilized archival ALMA band-6 observations, which was obtained in eight epochs. The data were calibrated using python script scriptForPI.py in appropriate CASA version. Once the data were calibrated, and measurement set (MS) was generated, we used CASA 6.5.4.9 for the following tasks. First, using CASA task tclean, we generated clean images with appropriate cell sizes with weighting = briggs (robust = 0.5) and original beam sizes. We used all the spectral windows to generate each clean image. With the same process, the clean images for individual spectral windows are also generated, which we used to calculate the spectral index (αmm).
In order to maintain consistency of the spatial resolution across the different epochs, we made their final clean images with a same beam size of  , which represents the lowest resolution observations. We found the fluxes with the original beam size are within ∼5% of the ones with the beam size of
  . Hence, we used the fluxes obtained from the original beam size in the paper. Figure C.1 shows the variation of 230 GHz peak flux density (S230 GHz) with the average beam size (θavg). The average beam size is calculated as
  . The observed flux is independent of the beam size, indicating our result is not affected by the different beam sizes.
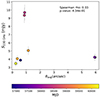 |
Fig. C.1. Variation of the peak flux density (S230 GHz) with average beam size (θavg). |
Appendix D: X-ray data analysis
The 2−10 keV fluxes were estimated by analyzing 0.5−10 keV Swift/XRT spectra, processed using the UK Swift Science Data Centre tools (Evans et al. 2009). Spectra were modeled in XSPEC as TBABSGAL × ZPHABS × (BB+POWERLAW), where TBABSGAL and ZPHABS account for Galactic and intrinsic absorption, and the DISKBB and POWERLAW components represent soft-excess and Comptonized emission, respectively.
All Tables
All Figures
|
Fig. 1. ALMA image of NGC 1566 in band 6 at 230 GHz, observed on 2022-06-14. The synthesized beam size (gray ellipse at the lower corner) is |
| In the text | |
|
Fig. 2. Light curves of NGC 1566. Top panel: Swift/BAT flux (14−150 keV; F14−150 keV). Middle panel: Swift/XRT flux (F2−10 keV; 2−10 keV). Bottom panel: ALMA band 6 flux (230 GHz; F230 GHz). The F14−150 keV, F2−10 keV, and F230 GHz are given in units of erg cm−2 s−1. The blue circles and orange diamonds represent the data from type 1 and type 2 states, respectively. The Swift/BAT data are obtained from the BAT 157-month catalog and the BAT hard X-ray transient monitor for two periods, until 2017 and after 2018, respectively. Due to unavailability of the data, there is a gap between January 2018 and December 2018 in the Swift/BAT light curve. The BAT data are binned over 30 days, while the XRT data correspond to single exposures. |
| In the text | |
|
Fig. 3. Variation of the mm flux at 230 GHz (F230 GHz) as a function of the 14–150 keV X-ray flux (F14−150 keV). The solid red line represents the best-fit. The dashed black line represents the F230 GHz−F14−150 keV relation from Kawamuro et al. (2022). |
| In the text | |
|
Fig. 4. Variation of the ratio of the mm flux to the X-ray flux as a function of Eddington ratio. The horizontal dashed line represents the ratio of the mm flux to the X-ray flux from Kawamuro et al. (2022). |
| In the text | |
|
Fig. 5. Variation of the in-band spectral index (αmm) as a function of 230 GHz flux (F230 GHz). The solid red line indicates the best fit. |
| In the text | |
|
Fig. B.1. Light curves of NGC 1566. Top panel: UV flux from Swift/UVOT in UVW2 band (FUVW2). Middle panel: Optical flux (Fopt) from ASSAS-Sn. The orange diamonds and green circles represent the light curve in the V and G band, respectively. Bottom panel: MIR fluxes (FMIR), obtained from WISE and NEO-WISE. The red circles and purple diamonds represent the light curve in W1 and W2 bands, respectively. |
| In the text | |
|
Fig. C.1. Variation of the peak flux density (S230 GHz) with average beam size (θavg). |
| In the text | |
Current usage metrics show cumulative count of Article Views (full-text article views including HTML views, PDF and ePub downloads, according to the available data) and Abstracts Views on Vision4Press platform.
Data correspond to usage on the plateform after 2015. The current usage metrics is available 48-96 hours after online publication and is updated daily on week days.
Initial download of the metrics may take a while.