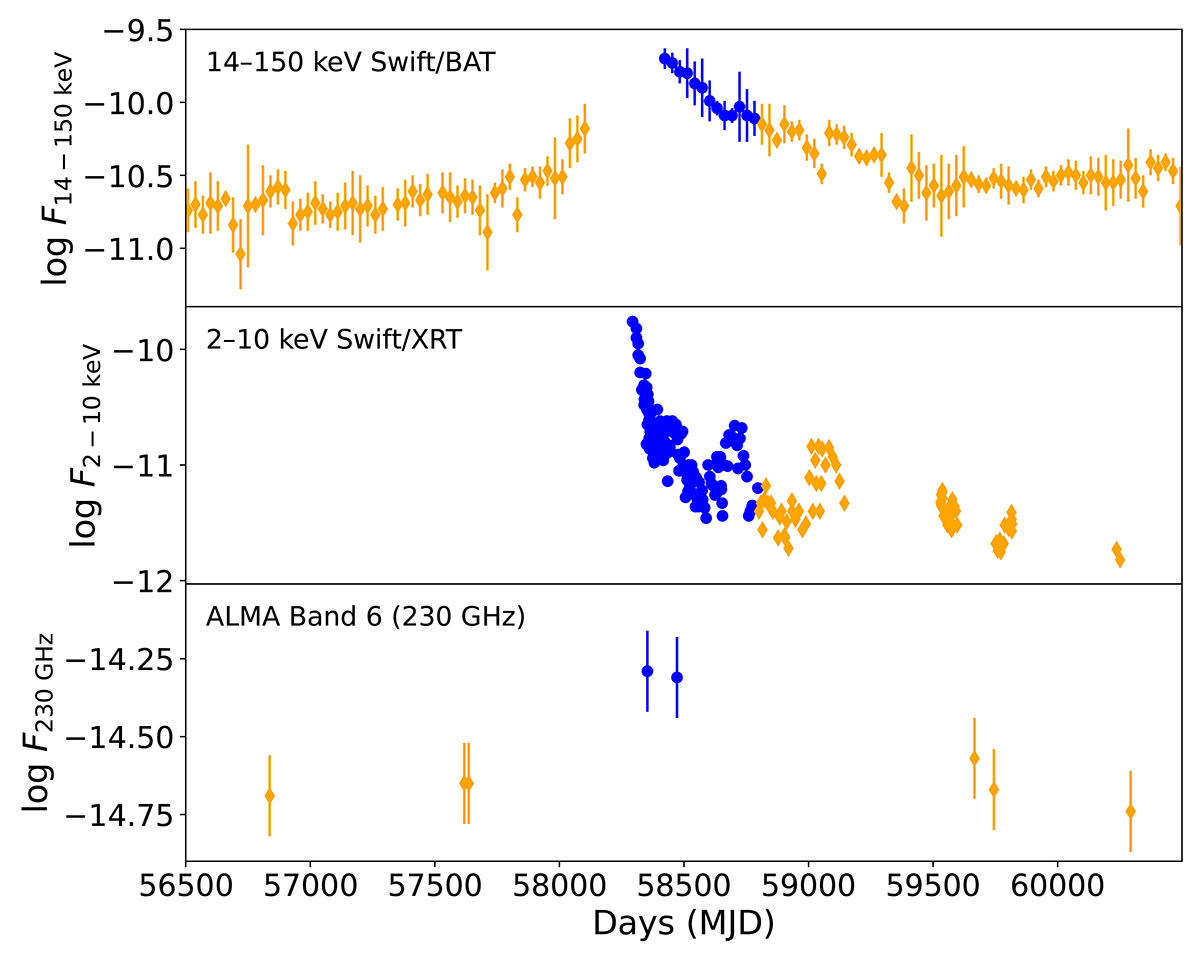
Fig. 2.
Download original image
Light curves of NGC 1566. Top panel: Swift/BAT flux (14−150 keV; F14−150 keV). Middle panel: Swift/XRT flux (F2−10 keV; 2−10 keV). Bottom panel: ALMA band 6 flux (230 GHz; F230 GHz). The F14−150 keV, F2−10 keV, and F230 GHz are given in units of erg cm−2 s−1. The blue circles and orange diamonds represent the data from type 1 and type 2 states, respectively. The Swift/BAT data are obtained from the BAT 157-month catalog and the BAT hard X-ray transient monitor for two periods, until 2017 and after 2018, respectively. Due to unavailability of the data, there is a gap between January 2018 and December 2018 in the Swift/BAT light curve. The BAT data are binned over 30 days, while the XRT data correspond to single exposures.
Current usage metrics show cumulative count of Article Views (full-text article views including HTML views, PDF and ePub downloads, according to the available data) and Abstracts Views on Vision4Press platform.
Data correspond to usage on the plateform after 2015. The current usage metrics is available 48-96 hours after online publication and is updated daily on week days.
Initial download of the metrics may take a while.