Open Access
Fig. 3.
Download original image
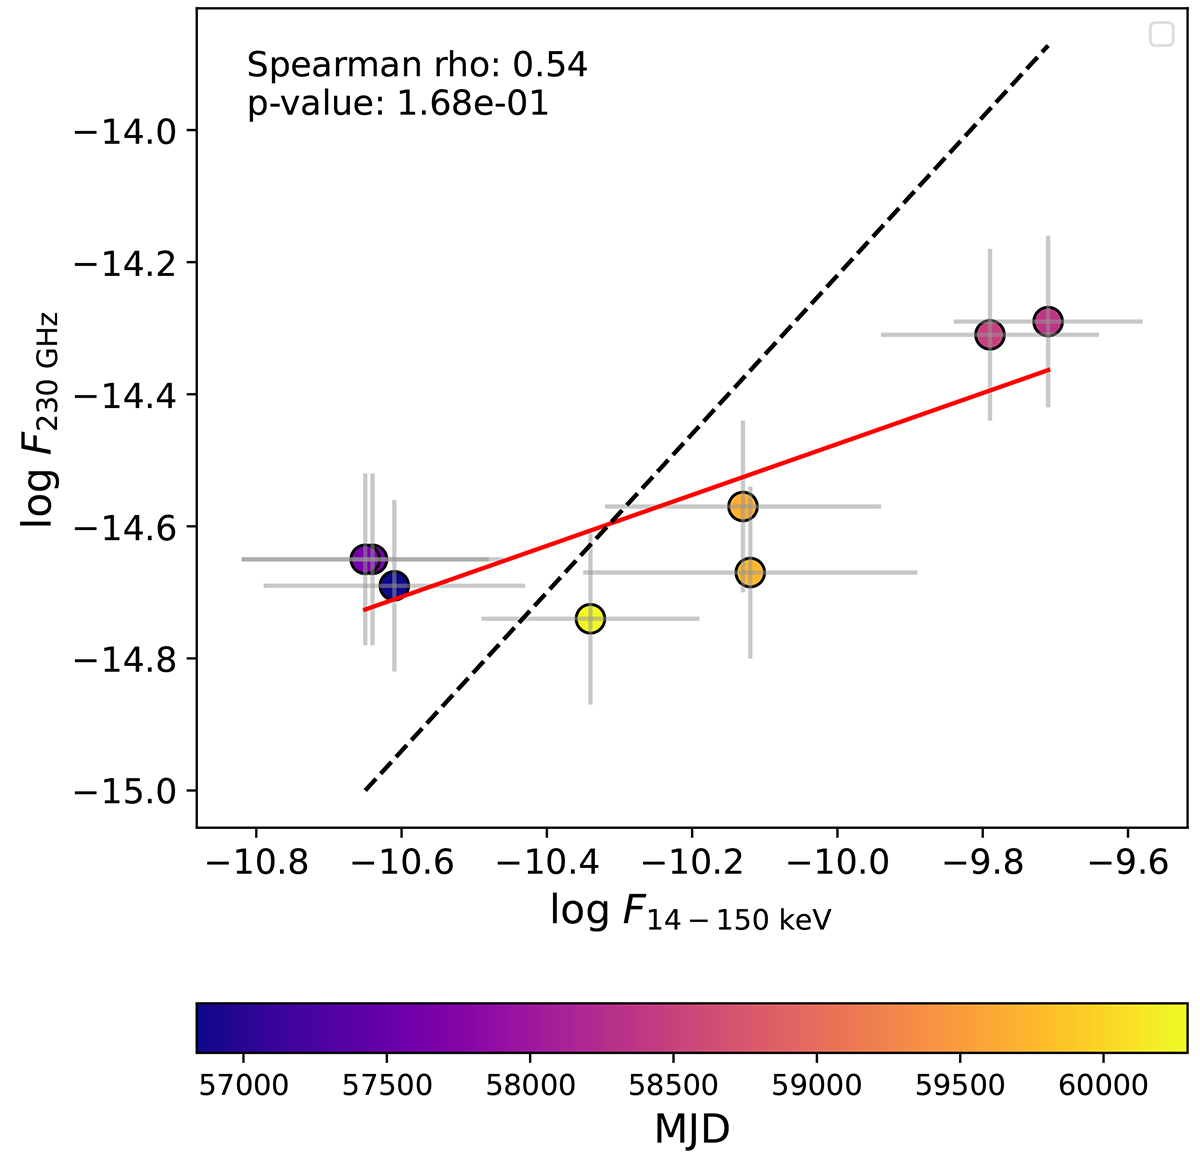
Variation of the mm flux at 230 GHz (F230 GHz) as a function of the 14–150 keV X-ray flux (F14−150 keV). The solid red line represents the best-fit. The dashed black line represents the F230 GHz−F14−150 keV relation from Kawamuro et al. (2022).
Current usage metrics show cumulative count of Article Views (full-text article views including HTML views, PDF and ePub downloads, according to the available data) and Abstracts Views on Vision4Press platform.
Data correspond to usage on the plateform after 2015. The current usage metrics is available 48-96 hours after online publication and is updated daily on week days.
Initial download of the metrics may take a while.