Open Access
Fig. 4
Download original image
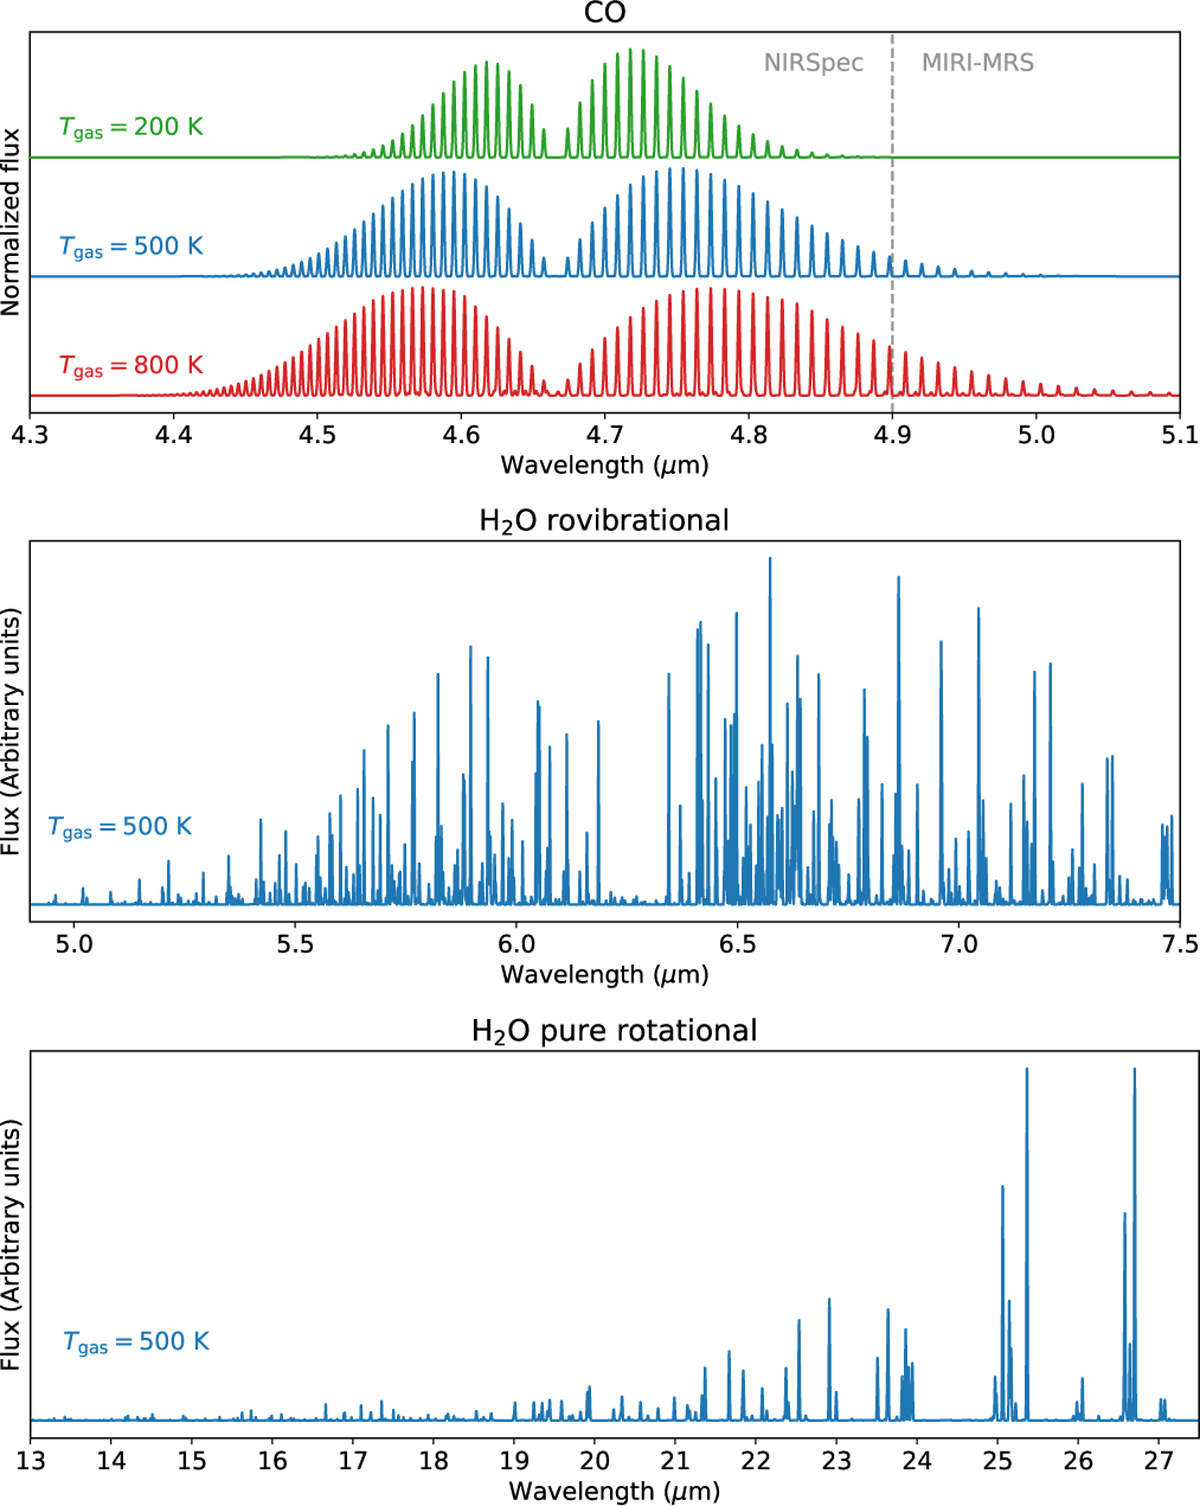
Examples of normalized mid-infrared slab model molecular emission spectra in the optically thin regime. From top to bottom, CO at 500 K compared with 200 and 800 K, H2O ro-vibrational lines at 5-7 μm, and H2O pure rotational lines at 13-28 μm, both at 500 K.
Current usage metrics show cumulative count of Article Views (full-text article views including HTML views, PDF and ePub downloads, according to the available data) and Abstracts Views on Vision4Press platform.
Data correspond to usage on the plateform after 2015. The current usage metrics is available 48-96 hours after online publication and is updated daily on week days.
Initial download of the metrics may take a while.