Open Access
Fig. F.1
Download original image
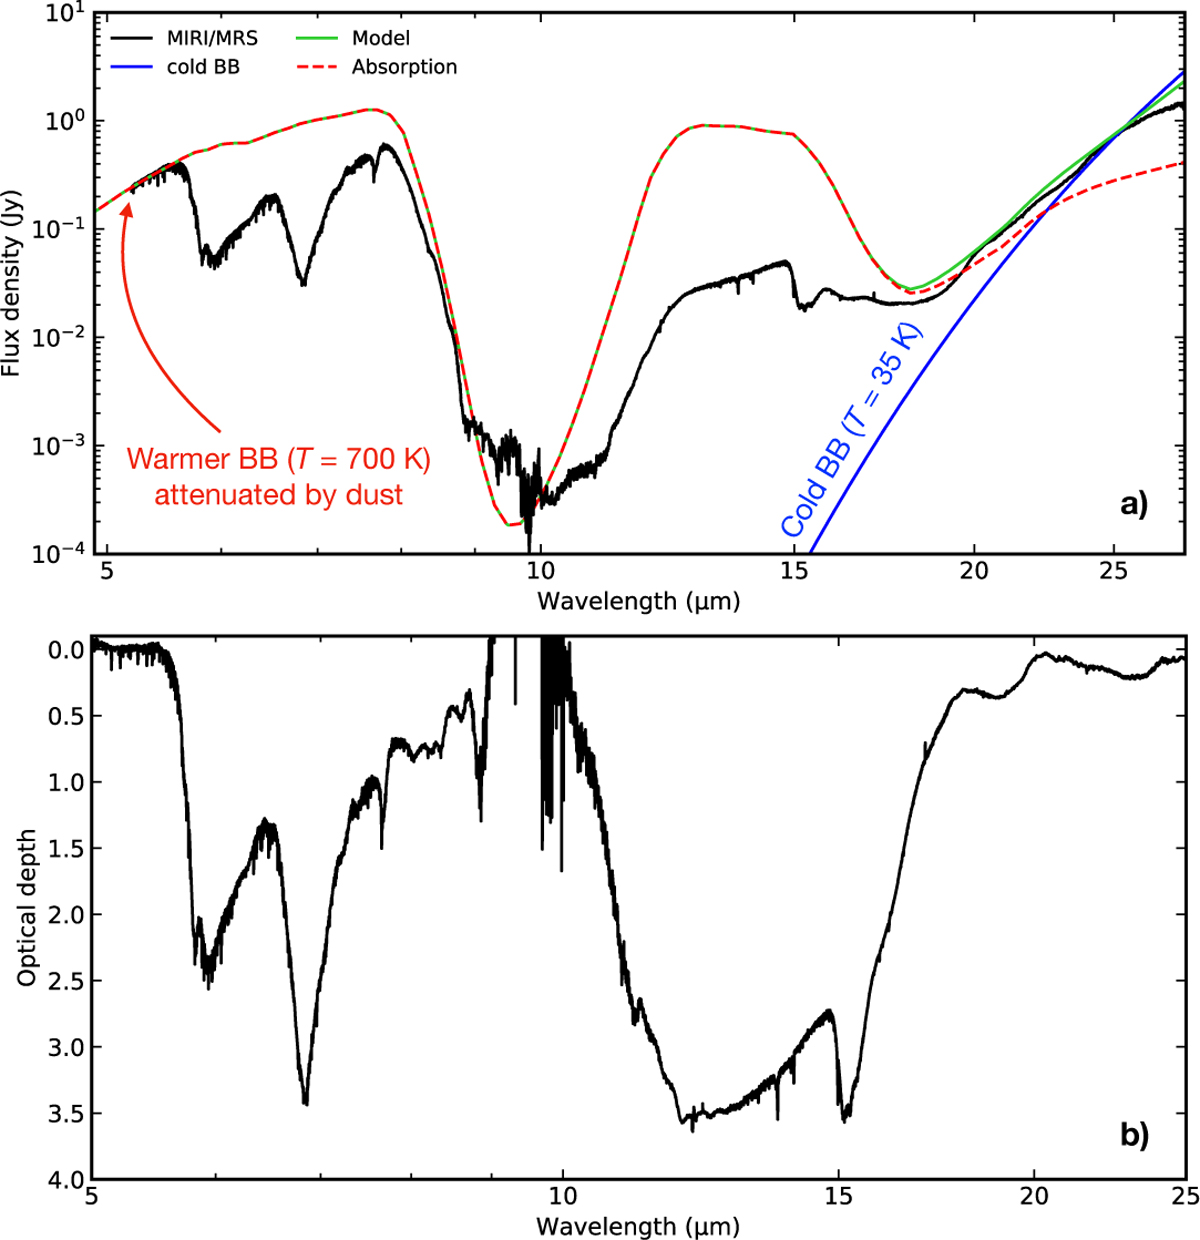
Spectrum of IRAS 18089 before and after global continuum and silicate subtraction. Panel a (top) shows the simplified model for IRAS 18089 given by a warm (red line) and cold (blue line) blackbody emission. Panel b (bottom) displays the optical depth scale of IRAS 18089 with both continuum and silicate subtracted.
Current usage metrics show cumulative count of Article Views (full-text article views including HTML views, PDF and ePub downloads, according to the available data) and Abstracts Views on Vision4Press platform.
Data correspond to usage on the plateform after 2015. The current usage metrics is available 48-96 hours after online publication and is updated daily on week days.
Initial download of the metrics may take a while.