Fig. 26
Download original image
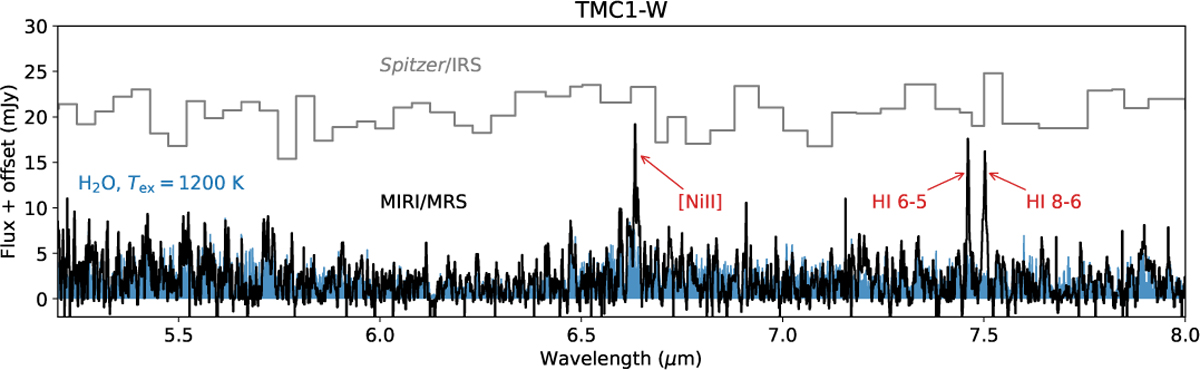
JWST MIRI-MRS spectrum of the Class I TMC1-W source showing a forest of hot H2O water lines. A LTE slab model at 1200 K is included for comparison in blue. The Spitzer-IRS spectrum of the binary TMC1 source is shown for comparison, illustrating that these types of detections were not possible prior to JWST. Figure adapted from van Gelder et al. (2024a), which shows the model spectrum offset from the data.
Current usage metrics show cumulative count of Article Views (full-text article views including HTML views, PDF and ePub downloads, according to the available data) and Abstracts Views on Vision4Press platform.
Data correspond to usage on the plateform after 2015. The current usage metrics is available 48-96 hours after online publication and is updated daily on week days.
Initial download of the metrics may take a while.