Open Access
Fig. 23
Download original image
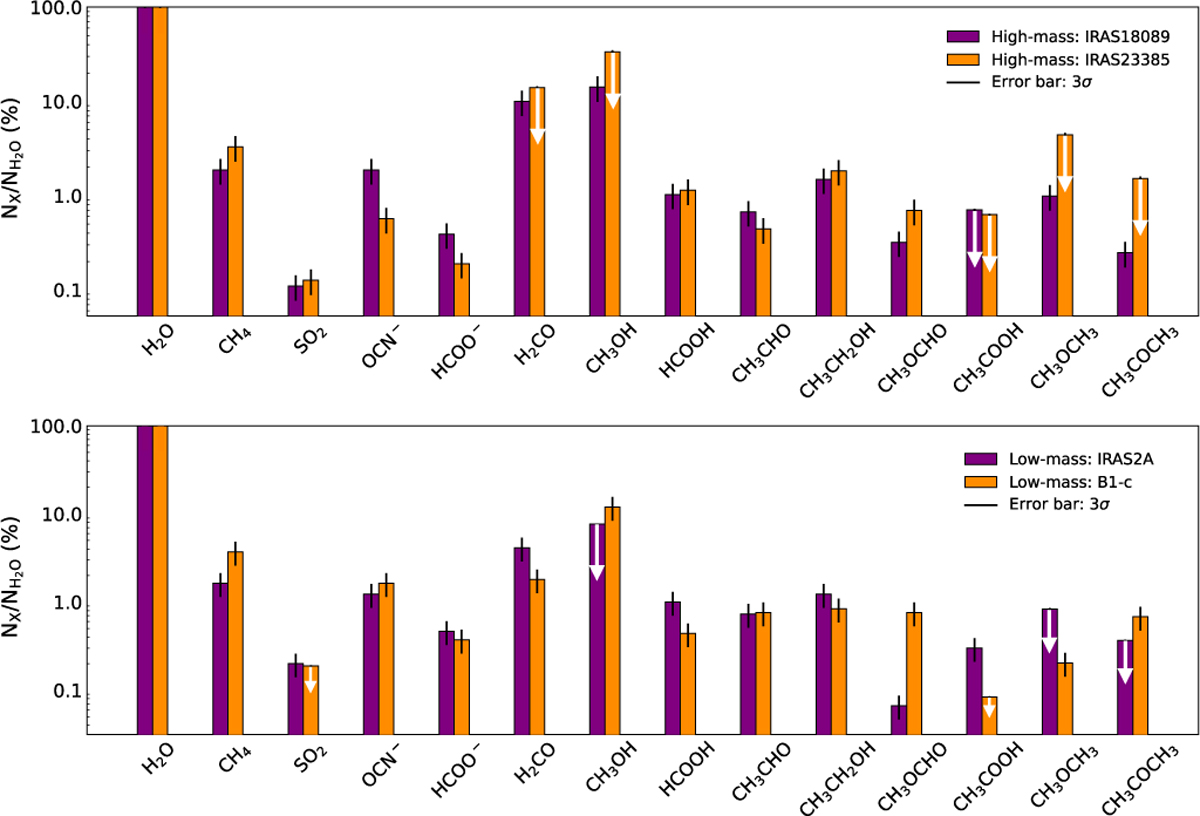
Comparison of ice abundances relative to that of H2O for the high-mass sources IRAS 18089 and IRAS 23385 (top) versus the low-mass protostars NGC 1333 IRAS2A and B1-c (bottom). White arrows indicate upper limits. The IRAS2A and IRAS 23385 results are taken from Rocha et al. (2024) and B1-c from Chen et al. (2024).
Current usage metrics show cumulative count of Article Views (full-text article views including HTML views, PDF and ePub downloads, according to the available data) and Abstracts Views on Vision4Press platform.
Data correspond to usage on the plateform after 2015. The current usage metrics is available 48-96 hours after online publication and is updated daily on week days.
Initial download of the metrics may take a while.