Open Access
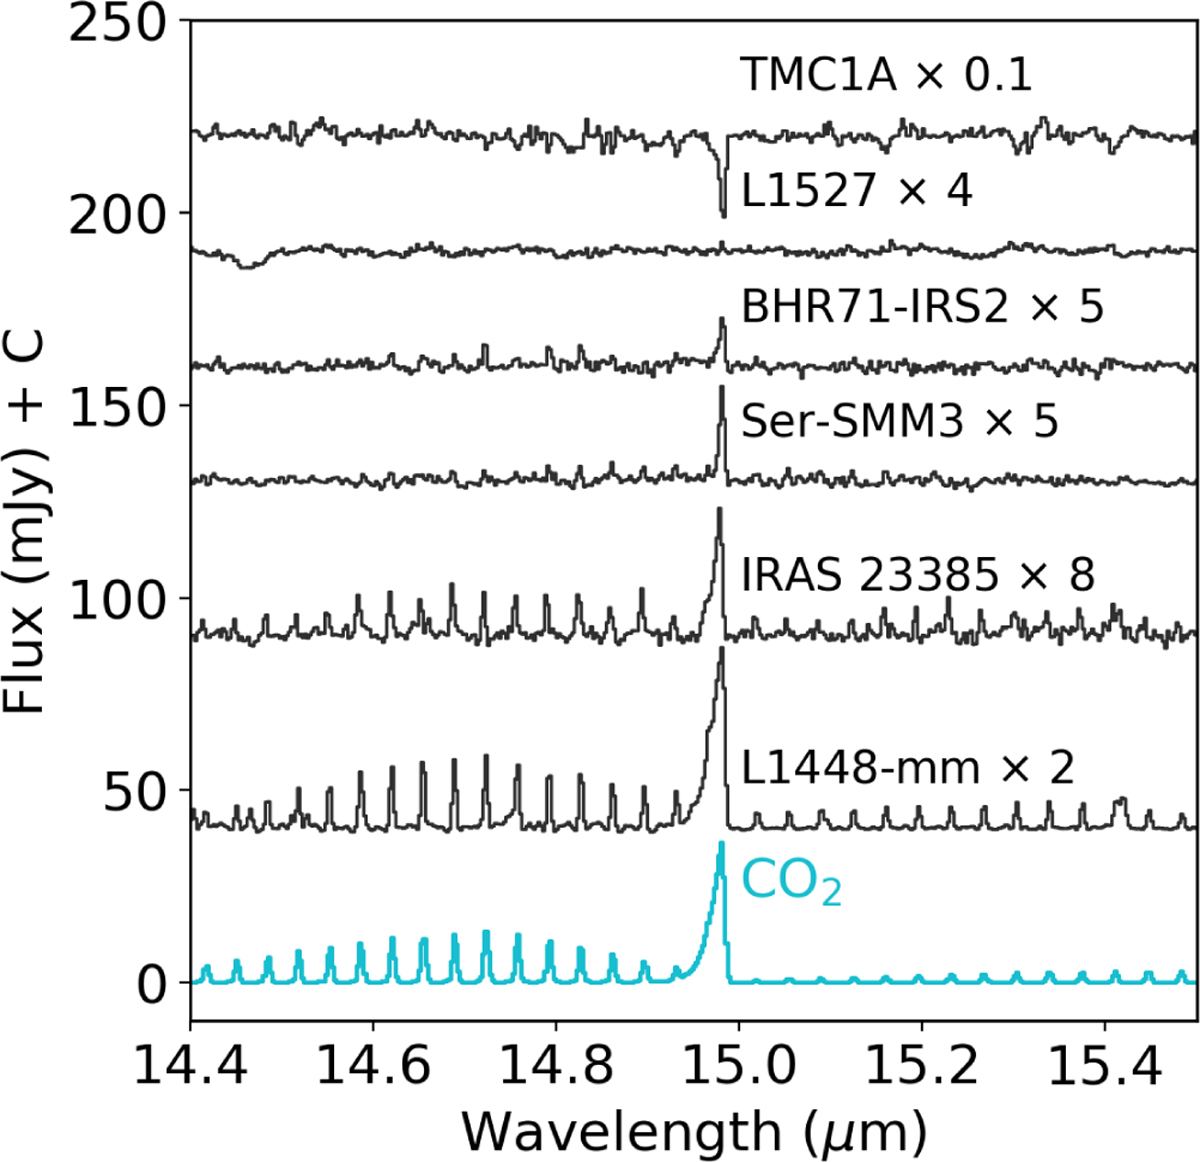
Fig. 15
Download original image
Comparison of CO2 15 μm emission and absorption toward several low- and high-mass protostars. The bottom panel shows a model spectrum at T =120 K (best fit for L1448-mm), with the P-branch extincted by CO2 ice.
Current usage metrics show cumulative count of Article Views (full-text article views including HTML views, PDF and ePub downloads, according to the available data) and Abstracts Views on Vision4Press platform.
Data correspond to usage on the plateform after 2015. The current usage metrics is available 48-96 hours after online publication and is updated daily on week days.
Initial download of the metrics may take a while.