Fig. 12
Download original image
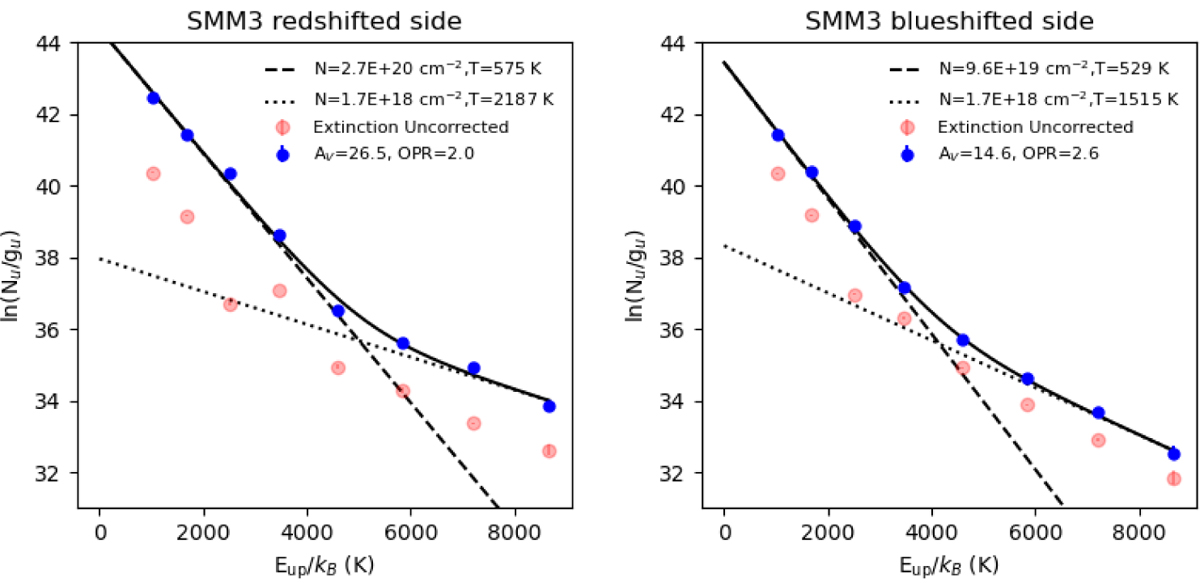
Rotational diagrams of H2 at the blue (left) and red (right) lobes using spectra extracted at the positions indicated in Fig. 10. The light red points indicate the values before extinction correction, the full blue points after extinction correction. Two temperatures and an OPR have been fitted to the extinction-corrected fluxes.
Current usage metrics show cumulative count of Article Views (full-text article views including HTML views, PDF and ePub downloads, according to the available data) and Abstracts Views on Vision4Press platform.
Data correspond to usage on the plateform after 2015. The current usage metrics is available 48-96 hours after online publication and is updated daily on week days.
Initial download of the metrics may take a while.