| Issue |
A&A
Volume 699, July 2025
|
|
|---|---|---|
| Article Number | A351 | |
| Number of page(s) | 19 | |
| Section | Stellar structure and evolution | |
| DOI | https://doi.org/10.1051/0004-6361/202554292 | |
| Published online | 23 July 2025 | |
Implications of a turbulent convection model for classical Cepheids
1
INAF-Osservatorio astronomico di Capodimonte, Via Moiariello 16, I-80131 Napoli, Italy
2
Department of Physics, Cotton University, Panbazar, Guwahati 781001, Assam, India
3
Max-Planck-Institut für Astrophysik, Karl-Schwarzschild-Straße 1, 85748 Garching, Germany
4
Heidelberg Institute for Theoretical Studies (HITS), Schloss-Wolfsbrunnen Weg 35, Heidelberg, Germany
5
Ludwig-Maximilians-Universität München, Geschwister-Scholl-Platz 1, 80539 Munich, Germany
⋆ Corresponding author: This email address is being protected from spambots. You need JavaScript enabled to view it.
Received:
27
February
2025
Accepted:
5
June
2025
Abstract
Context. The appearance of blue loops in the evolutionary tracks of intermediate-mass core He-burning stars is essential for explaining the observed characteristics of Cepheïds. The blue loops for lower mass Cepheïds cannot always be reproduced when only classical, local mixing length theory (MLT) is used. Additionally, classical models result in a mass discrepancy compared to pulsational and dynamical mass determinations. Both problems can be resolved through an ad hoc extension of the MLT for convection.
Aims. We use the nonlocal Kuhfuss turbulent convection model (TCM), which allows us to explain the overshooting directly by solving the TCM equations. The primary objective of this study is to test the predictions of the Kuhfuss TCM when applied to intermediate-mass core He-burning stars and validate the model predictions against observations of Cepheïds.
Methods. We used the state-of-the-art 1D stellar evolution code GARSTEC with the implementation of the Kuhfuss TCM and computed evolutionary tracks for intermediate-mass core He-burning stars. We compared these tracks with those computed with MLT, including and excluding ad hoc overshooting and with observations of five Cepheïds in detached binary systems obtained from the literature.
Results. The stellar evolution tracks generated using the Kuhfuss TCM and MLT with ad hoc overshooting exhibit similar appearances. Overshoot mixing from the convective boundaries and the occurrence of the Cepheïd blue-loop have been achieved naturally as solutions to the equations of the Kuhfuss TCM. Furthermore, the evolutionary models, including the Kuhfuss TCM, have been successful in reproducing the observed stellar parameters, including mass, luminosity, radius, and effective temperature.
Conlcusions. We successfully generated Cepheïds’ blue loops with a TCM without any fine-tuning of the involved numerical parameters and with overshooting predicted directly from the convection theory. Beyond the achievement of blue loops, our approach which treats convection more physically has also been able to reproduce the observations of Cepheïds in eclipsing binary systems, with a similar level of accuracy as MLT models with ad hoc overshooting.
Key words: convection / turbulence / stars: evolution / stars: variables: Cepheids
© The Authors 2025
 Open Access article, published by EDP Sciences, under the terms of the Creative Commons Attribution License (https://creativecommons.org/licenses/by/4.0), which permits unrestricted use, distribution, and reproduction in any medium, provided the original work is properly cited.
This article is published in open access under the Subscribe to Open model. This email address is being protected from spambots. You need JavaScript enabled to view it. to support open access publication.
1. Introduction
Convection is one of the most important mechanisms for the transport of energy, angular momentum, and chemical elements within stars. It significantly impacts the stellar structure, evolution, and pulsation properties. However, convection within stars is a highly turbulent, non-linear, and time-dependent three-dimensional (3D) phenomenon, resulting in considerable computational demands. Furthermore, the implementation of 3D turbulent convection into simplified one-dimensional (1D) calculations is very challenging.
In the literature, the prevailing approach for describing convection is the widely adopted mixing length theory (MLT Biermann 1932; Böhm-Vitense 1958). However, MLT is time-independent and local in nature. It considers the boundary of convectively unstable regions (so-called Schwarzschild or Ledoux boundary) as rigid, thus falling short in explaining convective motions beyond this boundary. This scenario is unphysical because when convective fluid parcels approach the boundary with nonzero velocity, the velocity cannot drop to zero immediately at the Schwarzschild boundary and the fluid parcel will penetrate some distance into the stable layers to decelerate. Moreover, convective eddies are expected to rise above the Schwarzschild boundary based on 3D simulations as well as observations (e.g.,Andersen 1991; Paterno et al. 1993; Caputo et al. 2000; Pietrinferni et al. 2004; Keller 2008; Andrássy 2015; Anders et al. 2022; Higgins & Vink 2023). For example, the standard MLT models without further additions do not produce blue loops extended enough in the evolutionary tracks of classical Cepheïds (hereafter, Cepheïds) for certain masses. Cepheïds are a class of intermediate-mass pulsating stars for which the existence and extent of the blue loops are essential. To account for convective overshooting effects in stellar models, the standard MLT can be modified. The influence of convective eddies rising into the formally stable layers above the Schwarzschild boundary can be mimicked by introducing additional mixing beyond this boundary. This is a concept we refer to as “ad hoc overshooting”. This is done either by extending the chemical mixing beyond the Schwarzschild boundary by a certain fraction of the pressure scale height (step overshooting) or by using a diffusive process (Freytag et al. 1996), where the diffusion coefficient decreases exponentially with the distance from the Schwarzschild boundary (exponential or diffusive overshooting).
The inclusion of ad hoc overshooting in MLT has successfully produced the Cepheïd blue loops (Caputo et al. 2000; Keller 2008; Cassisi & Salaris 2011; Miller et al. 2020; Bono et al. 2024). The parameters of this approach can be calibrated to observations. However, there is no physical justification to generalize these parameter values, calibrated to a certain set of observations, to all possible applications. Besides, it fails to predict the temperature gradient within the overshooting region or the extent of this region. Furthermore, due to its time-independent nature, MLT models are not suitable for interpreting any dynamical process whose characteristic timescale is comparable to that of convection. One such crucial process is stellar pulsation. This underlines the need to incorporate more physically grounded, numerically feasible and nonlocal theories of convection such as a “turbulent convection model” (TCM) into stellar structure and evolutionary and pulsation models. TCMs are derived from the basic hydrodynamic conservation equations, which describe the dynamics of the turbulent convective motions. Convective overshooting naturally emerges from solving these equations without requiring any ad hoc descriptions. Additionally, TCMs provide the convective flux, enabling the prediction of the temperature gradient in the overshooting region.
A large number of TCMs developed for stellar convection can be found in the literature (Xiong 1978, 1986; Stellingwerf 1982; Kuhfuß 1986, 1987; Canuto 1992, 1993, 1997, 2011; Canuto & Dubovikov 1998; Li & Yang 2007). These models vary in terms of the chosen variables, approximations, and assumptions (Kupka et al. 2022, and references therein). The TCM developed by Kuhfuß (1986, 1987) exists in two versions: the 1-equation (Kuhfuß 1986) and 3-equation (Kuhfuß 1987) models. The original version of the Kuhfuss TCM has undergone improvements by Wuchterl & Feuchtinger (1998), Flaskamp (2003), Kupka et al. (2022), and Ahlborn et al. (2022). In the present study, we use the improved version of the Kuhfuss 1-equation TCM, which has already been implemented into the Garching Stellar Evolution Code (GARSTEC; Weiss & Schlattl 2008). For further details on the implementation of the Kuhfuss TCM, we refer to Flaskamp (2003), Kupka et al. (2022), Ahlborn et al. (2022) and Braun et al. (2024). This model has already undergone thorough testing in the context of convective cores of intermediate-mass main-sequence stars and has demonstrated good agreement with models using MLT with ad hoc overshooting, which were tuned to match observations (Ahlborn et al. 2022). However, the prediction of a standard solar model calculated with the Kuhfuss 1-equation TCM does not align well with the observed sound-speed profile and the depth of the convective envelope of the Sun (Braun et al. 2024). This discrepancy necessitates further testing of the Kuhfuss TCM in stellar models across different mass ranges and different evolutionary stages.
In the present study, we focus on testing and extending the mixing properties of the 1-equation model and how they perform when applied to intermediate-mass core He-burning stars, particularly Cepheïds. Cepheïds represent a class of intermediate-mass pulsating stars in the core He-burning phase. They are particularly known because of their period-luminosity relation (PLR), which makes them excellent distance indicators (Leavitt 1908; Leavitt & Pickering 1912; Bhardwaj et al. 2023). Besides being crucial distance indicators, Cepheïds also provide us with ideal stellar laboratories to test and validate stellar evolutionary and pulsation theories because of the additional information we can obtain about these stars due to their pulsations.
To test the 1-equation model, we made use of the “Cepheïd mass discrepancy” problem (Stobie 1969; Cox 1980; Keller 2008), which is known to be sensitive to the treatment of convection in the evolutionary models (Cassisi & Salaris 2011). The “Cepheïd mass discrepancy” problem is a long-standing puzzle in the field of stellar evolutionary and pulsation theories. Nevertheless, this has presented us with a unique opportunity to refine theoretical frameworks. A Cepheïd's mass can be determined using both its evolutionary and pulsation properties. However, the Cepheïd's evolutionary mass has been found to be significantly higher than the pulsation mass (Stellingwerf 1982). Cox (1980) reported this mass discrepancy to be ∼40%. The improved opacity calculations performed by the OPAL group (Iglesias & Rogers 1993, 1996) have reduced this discrepancy to ∼(10−20)%. Nevertheless, it was not clear whether the evolutionary mass or pulsation mass was correct until recently.
Pietrzyński et al. (2010) measured, for the first time, the dynamical mass of Cepheïds to an accuracy of 1% for the OGLE-LMC-CEP-0227 double line eclipsing binary system. Their findings indicate consistency between the dynamical mass and the pulsation mass within the margins of error. Hence, the possible solutions for the remaining discrepancy concern the improvement of the physics of the evolutionary model such as convective core overshooting, mass loss, and rotational mixing (Keller 2008; Neilson et al. 2011; Prada Moroni et al. 2012; Anderson et al. 2014, and references therein). Convective core overshooting during main sequence (MS) evolution leads to a more massive post-MS helium core, thereby resulting in a more luminous Cepheïd for the same mass (Cassisi & Salaris 2011). Incorporating mass loss during the Cepheïd evolution can reduce the stellar mass without affecting the stellar luminosity significantly (Neilson et al. 2011). Finally, including rotation can also increase the luminosity of the Cepheïd without increasing the initial mass (Anderson et al. 2014). The model fitting of light curves and radial velocity and radius time series of the Cepheïd by Marconi et al. (2013) also provided an indication for a slightly noncanonical mass-luminosity relation to be in better agreement with observation. Thus, including these effects in evolutionary models will help us to bring the evolutionary mass and the dynamical mass into agreement. The present study focuses on the more physical treatment of convective core overshooting. Our goal is to test the TCM by Kuhfuß (1986) by comparing model predictions with observations of Cepheïds in binary systems. In all cases the mass of the Cepheïd is close to 4 M⊙ and, thus, on the lower end of the Cepheïd mass range, where classical MLT models either do not produce blue loops or produce blue loops that do not cross the Cepheid instability strip (cf. Fig. 1).
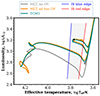 |
Fig. 1. Comparison of the evolutionary tracks for a 5 M⊙ star from the Zero-Age Main Sequence to the core He-burning phase. The tracks are computed using GARSTEC with three different convection treatments: MLT only (gray), MLT with ad hoc overshooting (orange), and Kuhfuss 1-equation TCM (cyan). The blue and red lines represent the theoretical blue and red edges of the instability strip, respectively, as estimated by Deka et al. (2024). The black dot represents a model with a central helium abundance of 0.6, whose turbulent kinetic energy profile is shown in Fig. 2. |
This paper is organized as follows. We give a brief mathematical overview of the Kuhfuss 1-equation model (TCM1) in Sect. 2.1. In Sect. 2.2, we discuss the computation of stellar models with TCM1 and the “ ad hoc MLT plus overshooting” approach, along with the different parameters adopted in the calculations. Then, we compare TCM1 results with the MLT model without and with the addition of overshooting in Sect. 3. In Sect. 4, we explore how applying nonlocality to different convective boundaries in a star affects the blue loops. Sect. 5 presents the models for the five Cepheïd binary systems we studied (OGLE-LMC-CEP-0227, OGLE-LMC-CEP-1812, OGLE-LMC-CEP-4506, OGLE-LMC-CEP-2532, and OGLE-LMC-CEP-1718). We discuss the impact of the various uncertainties involved in both theory and observations in Sect. 6. Finally, our conclusions and future prospects for our findings are presented in Sect. 7.
2. Stellar evolutionary models with TCM
2.1. The Kuhfuss 1-equation turbulent convection model
Kuhfuß (1986, 1987) developed a TCM by applying the Reynolds stress formalism to the fundamental hydrodynamic equations. The TCM incorporates nonlocality and the time dependence of convection. This allows the TCM to quantify the extent of the convective boundary mixing (CBM) region based on nonzero velocities as well as the temperature gradient within this region.
The TCM of Kuhfuss exists in two versions: a 1-equation and 3-equation model (Kuhfuß 1986, 1987). The 1-equation version (TCM1) is the simplified version that determines the turbulent kinetic energy (TKE; ω) using a single equation including the nonlocal terms. In the stationary and local limit, the standard MLT equations can be derived from this model. In the 3-equation formalism (hereafter, TCM3), two additional equations describing the convective flux (Π) and the second order entropy fluctuations (Φ) are considered. In the present work, we use the static version of TCM1, including the nonlocal terms.
The equation that describes the TKE (ω) in TCM1 is given as:
 (1)
(1)
where ∇ and ∇ad represent the model and adiabatic temperature gradient, respectively; then, αs is a free parameter. The variable T corresponds to the stellar structure temperature and cp denotes the specific heat capacity at constant pressure. The viscous dissipation is described by the second term containing the free parameter CD, Λ is the length scale of TKE dissipation, which, in the original version of TCM1, is the product of the pressure scale height, Hp, and a free parameter, αΛ, which is analog to the mixing length parameter in MLT. The expression for Λ was modified by Wuchterl (1995) to account for small convective cores, where Hp diverges, and reads in the current version of TCM1,
 (2)
(2)
where r is the local radius and β is a free parameter.
The third term in Eq. (1) describes the nonlocal fluxes modeled as,
 (3)
(3)
This equation involves another free parameter, αω, which is used to adjust the measure of nonlocality in the model and ρ is the stellar density. The quantities with a bar are the spherically averaged quantities. As we are interested in the static case,  is set to zero in Eq. (1).
The main difference between TCM1 and TCM3 is that in the derivation of TCM1 the convective flux is assumed to be proportional to the entropy gradient,
 (4)
(4)
where the specific entropy gradient is defined as
 (5)
(5)
Therefore, the temperature gradient from the TCM1 can be obtained using the following equation:
 (6)
(6)
where ∇rad represents the temperature gradient when all the energy is transported by radiation and krad is the radiative conduction coefficient.
We refer to the free parameters involved in the TCM1; αΛ, αω, αs, CD, and β as TC parameters. The αΛ value was determined by a solar model calibration. A solar calibration was used to find a model with the same radius, luminosity, and surface metal to hydrogen fraction,  , as the present-day Sun. A sequence of stellar models with varying initial values of Y, Z, and αMLT or αΛ was calculated and evolved until the age of the Sun to find the correct combination of these parameters for a solar model. The solar calibration was done for a model with MLT with overshooting and a model with the TCM1 using the solar abundances as given by Grevesse & Sauval (1998). This gave αMLT = 1.79 and αΛ = 1.78 for the model with MLT and the model with TCM1, respectively. We note that while the αMLT is not a part of TCM1, it is needed for the MLT evolutionary models, which are used for comparison purposes (see Sect. 2.2). Then, αω was set to 0.3, following Ahlborn et al. (2022) who found this value results in a similar convective core size as that predicted by a model with MLT including ad hoc overshooting for a 5 M⊙ star; αs and CD were kept as in Kuhfuß (1986, 1987), obtained by calibrating the convective flux and convective velocity of the static and local version of TCM1 with the MLT predictions (Kuhfuß 1987; Ahlborn 2022). The β value was set to 1 following Straka et al. (2005). The values used in the present work are listed in Table 1. For detailed derivations and symbol definitions, we refer to the works of Kuhfuß (1986, 1987), Flaskamp (2003), Kupka et al. (2022), Ahlborn et al. (2022), Braun et al. (2024).
Values of turbulent convection model parameters used in this study.
2.2. Stellar evolutionary models
In this work, we computed two different sets of models. We first compared the evolutionary tracks with different convective approaches in Sect. 3 and then investigated how the characteristics of the evolutionary tracks change if nonlocality is included only at specific boundaries (Sect. 4). The second set of models is computed to compare with the observations of the detached eclipsing binaries (Sect. 5). For the first set, we computed evolutionary tracks for a star of mass 5 M⊙ from the zero-age main sequence (ZAMS) up to the end of the core He-burning phase. The tracks were computed using MLT alone, using MLT with exponential overshooting as outlined in Freytag et al. (1996) and using the TCM1. The initial model for the TCM1 was selected from the MLT plus exponential overshooting evolutionary tracks at the onset of the main sequence phase following Ahlborn et al. (2022).
We adopted the free equation of state (FreeEOS) (Alan W. Irwin) and employed OPAL opacities (Iglesias & Rogers 1996), supplemented by low-temperature opacities from Ferguson et al. (2005). For the results presented in Sects. 3 and 4, we chose the mass fractions of hydrogen X = 0.7144, helium Y = 0.2671, and metals Z = 0.0185 for the MLT models and X = 0.7152, Y = 0.2665, and Z = 0.0183 for the TCM1 models (obtained from solar calibration). The overshooting in the models using MLT plus ad hoc overshooting is controlled by the parameter fOV, which we set to fOV = 0.018. This parameter was calibrated by fitting GARSTEC-isochrones to the color-magnitude diagrams of open cluster (Magic et al. 2010). For the MLT and MLT plus overshoot calculations, the calibrated solar mixing length parameter is αMLT = 1.79, while for the TCM1 approach, it is αΛ = 1.78 (as described in Sect. 2.1).
For the results presented in Sect. 5, we used the same αΛ. The parameters different from the first set-up are the initial masses and chemical abundances, according to observational results. We specify them in the corresponding section specific to each system. To convert [Fe/H] to X,Y,Z, we use the following relations:
![Mathematical equation: $$ [\rm {Fe/H}] =\log {(Z/X)}-\log {(Z/X)}_{\odot }, $$](/articles/aa/full_html/2025/07/aa54292-25/aa54292-25-eq11.gif) (7)
(7)
 (8)
(8)
 (9)
(9)
where we adopt primordial helium, Y0 = 0.2485 from Hinshaw et al. (2013),  from Grevesse & Sauval (1998), and He-enrichment ratio
  obtained from solar calibration. We tabulated all the [Fe/H] and the corresponding X,Y, and Z values used in this work in Appendix A.
3. Comparison to MLT
The evolutionary tracks for a 5 M⊙ star calculated with 1) only MLT, 2) with MLT including ad hoc overshooting, and 3) with TCM1 are presented in Fig. 1, highlighting the differences among the three tracks. The Cepheïd blue and red instability strip (IS) edges plotted in Fig. 1 are taken from Deka et al. (2024). It becomes apparent that the MLT approach alone fails to reproduce the blue loops of Cepheïds of this (and lower) mass. When including ad hoc overshooting, the blue loops reappear, which can be seen from the orange line in Fig. 1 (e.g., Prada Moroni et al. 2012). Remarkably, the TCM1 has accomplished this without requiring any finetuning of the other involved numerical parameters. We also note that some other input physics, such as nuclear reaction rates, rotation, and metallicities influence the appearance of the blue loop (e.g., Lauterborn et al. 1971; Robertson 1971, 1972; Iben 1972; Bono et al. 2000; Xu & Li 2004; Anderson et al. 2014; Zhao et al. 2023). Due to the larger cores on the main sequence, the overall luminosity increases for the tracks with MLT plus ad hoc overshooting and TCM1 as compared to that with MLT only, thereby resolving the mass discrepancy. The extent of the blue loop with TCM1 without finetuning the free parameters involved is also similar to that of MLT with ad hoc overshooting models. Achieving extended blue loops that cross the instability strip for stars with masses closer to 4 M⊙ and a Galactic composition is very difficult. However, observationally, several such Cepheids have been observed (e.g.,Gallenne et al. 2018).
In Fig. 2, we show the internal structure of a 5 M⊙ star with a convective, He-burning core computed with TCM1. This model is marked in Fig. 1 by a black marker and has a central helium abundance of Yc = 0.6. The upper panel of Fig. 2 displays the TKE profile as a function of fractional mass. The lower panel shows the temperature gradients of the model and the Schwarzschild boundary, where ∇ad=∇rad. It can be seen that the convective core is extended beyond the Schwarzschild boundary, which has been achieved without any additional prescription of overshooting. The temperature gradient does not immediately drop to the radiative gradient at the Schwarzschild boundary. It becomes sub-adiabatic at the Schwarzschild boundary, but it stays very close to the adiabatic value throughout the CBM region and only transitions to the radiative gradient just before reaching the outer boundary of the CBM region.
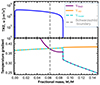 |
Fig. 2. Top: Turbulent kinetic energy profile as a function of fractional mass for an evolutionary model of a 5 M⊙ star computed using the TCM1 with a central helium abundance of Yc = 0.6. Bottom: Temperature gradient of the model (∇model, blue dashed line). The purple and orange lines indicate the radiative ∇rad and adiabatic ∇ad temperature gradients, respectively. The vertical gray dashed line denotes the Schwarzschild boundary. |
4. Influence of CBM at different convective boundaries on Cepheïd blue loops
The morphology and extent of the Cepheïd blue loop are influenced by several factors, such as convective core overshooting (Cassisi & Salaris 2011), rotation (Anderson et al. 2014; Zhao et al. 2023), nuclear reaction rates (Halabi et al. 2012), and helium and metal content (Bono et al. 2000). In this paper, we primarily focus on the role of convection. The significance of convective core overshooting during MS evolution is well established in the literature (e.g., Huang & Weigert 1983; Cassisi & Salaris 2011). Convective core overshooting not only increases the MS lifespan but also produces a larger convective core during the core He-burning phase, thereby resulting in a higher luminosity consistent with observations of Cepheïds (Huang & Weigert 1983).
In this section, we discuss the effect of CBM at different boundaries during the core He-burning phase on the blue loops using the Kuhfuss TCM1. The CBM emerges naturally in the solution of the equations due to the nonlocal nature of the model. To test the effect of nonlocality during the core He-burning phase, we first evolved a 5 M⊙ model until the end of the MS with nonlocality employed in the whole star. Then, at the end of the MS, we evolved the model considering nonlocality1 at all convective boundaries (case I), only at either the boundary of the envelope (case II) or the core (case III) and with no nonlocality at all boundaries in the He-burning phase (case IV) as given in Table 2.
Summary of the cases with CBM at different boundaries during the core He-burning phase.
Cases I, II, and III result in similar extensions of the blue loop, while Case IV leads to a shorter blue loop, as shown in Fig. 3. From this figure, it is evident that the timescale of core He-burning is affected by the consideration of the nonlocality of convection which also influences the structure of the blue loop. Models with a nonlocal He core have a longer core helium burning lifetime, as they have a larger reservoir of He to burn through. Furthermore, all these different cases seem to slightly affect the positioning of the second and third crossing of the blue loop in terms of luminosity. Blue loops are also generated without nonlocality during the core He-burning phase either in the core or in the envelope. This highlights the importance of including nonlocality in the MS. However, its inclusion either in the core or in the envelope or the whole star during the core He-burning phase has an impact on the extension and the vertical gap between the second and third crossings of the blue loop.
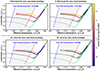 |
Fig. 3. Influence of convective boundary mixing at different boundaries during the core He-burning phase on the blue loops of a 5 M⊙ star. During the previous central hydrogen-burning phase the nonlocal TCM1 was applied. The four cases I-IV are indicated above the corresponding panel. The blue and red lines represent the blue and red edges of the instability strip, respectively, as estimated by Deka et al. (2024). The core He-burning region is color mapped by age. The green solid and dashed lines indicate the evolutionary tracks with and without nonlocality applied to the entire evolution of the star, respectively. |
The cases shown in Fig. 3 also allow us to investigate the influence of the nonlocal treatment of envelope convection (comparing the left and right panels). This treatment influences the extent and efficiency of the first dredge-up, during which the convective envelope penetrates progressively deeper into the former core region, mixing nuclear products of CNO-burning to the surface. In the nonlocal case, we observe a slightly higher helium enhancement, a more pronounced depletion of 12C, and a lower 12C/13C ratio. However, the differences compared to the local case remain small. For instance, the surface helium abundance increases by 0.025 in the local model and by 0.029 in the nonlocal one. Likewise, the nonlocal model exhibits a slightly lower effective temperature, but both evolutionary tracks overlap to a large extent, particularly in terms of the blue loop extension. This relatively small impact is a consequence of the truncated red giant branch (RGB) evolution in intermediate-mass stars. In contrast, for low-mass stars, one observable effect of overshooting at the base of the convective envelope is the shift in the brightness of the red giant bump in stellar clusters (Troisi et al. 2011; Joyce & Chaboyer 2015; Fu et al. 2018).
5. Comparison to observations
For a more comprehensive comparison between the evolutionary model computed using the TCM1 and observations, we selected five detached eclipsing binary systems from Pilecki et al. (2018). These systems consist of at least one companion which is a Cepheïd. Because these systems are detached (Pilecki et al. 2018), single star evolutionary tracks are in principle suitable for modeling the individual components. The stellar parameters are obtained from binary modeling, and are listed in Table B.1 (cf. Pilecki et al. 2018). The input parameters adopted for each system are mentioned in their corresponding subsections. We chose slightly higher initial masses than their current dynamical masses for all the systems. We utilized the same radiative mass-loss rates from Reimers (1975, 1977), employing a factor of η = 0.2 for all the systems. The metallicity has a substantial impact on the surface properties of Cepheïds (discussed in Sect. 6). Unfortunately, precise metallicity measurements are not available for any of the systems discussed in this work. Most previous studies addressing the mass discrepancy problem for OGLE-LMC-CEP-0227 adopted a metallicity of [Fe/H] = −0.33 (Cassisi & Salaris 2011; Prada Moroni et al. 2012), based on the mean metallicity of the LMC. However, this value was later refined by Romaniello et al. (2022) to −0.409, similar to the value by Choudhury et al. (2021) of −0.42±0.04. In fact, Marconi et al. (2013) reported a significantly lower value of [Fe/H] = −0.65 for OGLE-LMC-CEP-0227. Therefore, for all systems analyzed in this work, we initially assumed a metallicity of [Fe/H] = −0.5 following Gieren et al. (2015) and Pilecki et al. (2018), changing it to lower or higher values, if we thought this could improve the best fitting model. OGLE-LMC-CEP-1812 was not explored with alternative metallicity values, as its complex evolutionary discrepancies are unlikely to be resolved through adjustments in metallicity alone.
We estimated the final parameters from the tracks by minimizing the χ2 statistic, defined as:
where
-
Oi: Observed values of L/L⊙, Teff, and R/R⊙ for each component of the binary systems;
-
Ei: Corresponding theoretical values predicted by the evolutionary tracks;
-
σi: Uncertainty associated with each observed parameter;
-
N: Total number of observational constraints.
It is also important to note that in certain cases, despite achieving a minimum χ2 value, the derived parameters may seem to deviate from the evolutionary tracks in the HRD due to the small observed radius uncertainty dominating the χ2. The results are summarized in Tables 3, 4, 5, 6, and 7. Note that we do not aim for the absolutely best-fitting model. Our emphasis lies on the comparison between reasonably well-fitting models employing TCM or MLT plus overshooting. As such we did not, for example, vary masses within the observed uncertainty ranges or tested more than two metallicity values.
Stellar parameters obtained for the components of the OGLE LMC-CEP-0227 system from the evolutionary tracks are listed below.
Stellar parameters obtained for the components of the OGLE LMC-CEP-1812 system from the evolutionary tracks are listed below.
Stellar parameters obtained for the components of the OGLE LMC-CEP-4506 system from the evolutionary tracks are listed below.
Stellar parameters obtained for the components of the OGLE LMC-CEP-2532 system from the evolutionary tracks are listed below.
Stellar parameters obtained for the components of the OGLE LMC-CEP-1718 system from the evolutionary tracks are listed below.
5.1. OGLE-LMC-CEP-0227
OGLE-LMC-CEP-0227 is the first classical Cepheïd that was spectroscopically confirmed to be a member of an eclipsing binary system, and for which the dynamical masses and other physical parameters were determined (Pietrzyński et al. 2010). They found the mass of the Cepheïd (the “primary”) and the non-pulsating companion (“secondary”) to be very similar (4.14 ± 0.04 M⊙, resp. 4.14 ± 0.07 M⊙), such that within the errors the mass hierarchy is not conclusive. When modeling this system, Cassisi & Salaris (2011) and Prada Moroni et al. (2012) assumed that the secondary has a slightly higher mass. Pilecki et al. (2013) estimated the fundamental properties of this system with significantly improved precision as compared to Pietrzyński et al. (2010). In their re-analysis of the orbital solution, they claim that the mass of the companion is indeed lower than that of the Cepheïd (4.165 ± 0.003 M⊙ vs. 4.134 ± 0.004 M⊙). In Pilecki et al. (2018) they reported the masses to be 4.15±0.03 M⊙ and 4.06 ± 0.03 M⊙ for the Cepheïd and its companion. We adopted the values by Pilecki et al. (2013) for a first set of models (see Table 3).
The adopted initial masses are Mp = 4.195 M⊙ and Ms = 4.165 M⊙ for the primary and secondary, respectively, in order to account for the mass lost in earlier evolutionary phases. We first adopted for these calculations a metallicity of [Fe/H]=−0.5. The resulting tracks are shown in Fig. 4. The left panel shows the tracks in the R−Teff, and the right panel in the L−Teff plane. Both sets of evolutionary tracks consistently predict effective temperatures, luminosities, and radii that agree with the observed values. The Cepheïd component occupies the Cepheïd IS, whereas the non-pulsating companion is outside the IS.
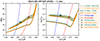 |
Fig. 4. Evolutionary tracks for OGLE-LMC-CEP-0227 computed using both MLT plus ad hoc overshooting (dashed lines) and TCM1 (solid lines). The left panel shows the tracks in the radius–effective temperature (RTeff) plane, while the right panel shows them in the luminosity–effective temperature (LTeff) plane. The observed positions in each plane are indicated by the colored stars (green for the primary, orange for the secondary). The best-fitting models are shown by colored circles. The observational error bars are indicated in this and all other plots, but are often comparable to or even smaller than the symbols, in particular in the (RTeff) plane. The blue and red lines in this plot represent the first overtone Cepheïd blue and red edges taken from Deka et al. (2024). This figure is discussed in detail in Sect. 5.1. |
While our models nicely reproduce the location in the HRD for both components, with the selected mass values the evolutionary state of the stars is inconsistent because the secondary (of lower mass, but same age) appears to be further evolved. This contradicts basic stellar physics, and was probably the reason why the authors of previous studies used an inverted mass ratio. We followed this approach as well and assigned tentatively the higher mass to the secondary and the lower one to the Cepheïd. The resulting evolutionary tracks are shown in Fig. C.1. The parameters of the models are also given in Table 3 under the label of “model with inverted mass ratio”. Now, the locations along the tracks are consistent with the more massive star being already in a more advanced phase of evolution. We suggest further mass determinations to clarify this relevant issue.
Since this, as all other systems we considered, lacks a precise metallicity estimate, we further computed evolutionary tracks for this system, slightly lowering the metallicity to [Fe/H]=−0.6, keeping the mass assignments as in the first case. The parameters of the resulting models that now reproduce the observed locations in the diagrams of Fig. D.1 are also given in Table. 3, labeled as the “low-metallicity model.” Also, in this case, the more massive star is the less evolved component.
An alternative solution to the problem could be of theoretical nature. For the original mass assignments, one could assume that the luminosity of our models might be too low by about 0.1 dex, and therefore both the ad hoc overshooting approach and our TCM1 model are both underestimating the size of the mixed core. In this case (shifting the tracks in Fig. 4 upward), the Cepheïd would lie on the lower blue loop branch, while the less massive non-pulsating companion would be close to entering it from the red, thereby being in agreement with theoretical expectations for the standard mass hierarchy. This could be achieved by increasing the nonlocal parameter, αω, of the TCM1 which would increase the convective core size on the MS and in turn lead to a higher luminosity in the core He-burning phase (Fig. B.2 in Ahlborn et al. 2022).
However, given the current constraints on the metallicity, it is also difficult to determine whether a different value of αω is really needed or whether the mismatch is just an effect of an incorrect metallicity. Considering the assumptions of the TCM1, we expect the same TC parameter values to apply to different systems. In conclusion, even this system, which has been modeled several times in the literature, is not free of open questions. It continues to pose challenges in both observational and theoretical studies.
5.2. OGLE-LMC-CEP-1812
OGLE-LMC-CEP-1812 is the second classical Cepheïd known to exist in an eclipsing binary system. The metallicity is taken to be [Fe/H]=−0.33 following Pietrzyński et al. (2011). We adopted the initial masses for the primary and secondary companion as 3.775 M⊙ and 2.635 M⊙, respectively. The tracks are displayed in Fig. 5. Interestingly, the Cepheïd is found to be in the first crossing of the IS similar to the previous studies (e.g., Neilson et al. 2012), which is a rare phenomenon as typically only a few percent of the Cepheïds should be found at this stage. This is because the intermediate-mass and massive stars evolve on a thermal timescale after they exhaust the hydrogen in their cores (cf. Gautschy 2022). Also, another crucial aspect of this system is that, as in the case of OGLE-LMC-CEP-0227, the less massive companion appears to be more evolved than the Cepheïd, independently of whether it is at the end of the first crossing or already in core He-burning. Neilson et al. (2015) modeled this system using MLT plus overshooting. They also found that the Cepheïd is located on the first crossing of the IS and that the companion is further evolved than the more massive Cepheïd implying that both stars reach their observed radii at different ages. Indeed, the ages of our best-fitting models differ far more than any uncertainty in the observed parameters could explain. One explanation put forward for this age anomaly is that this system originally was a triple system, and the Cepheïd evolved from the merger of two MS stars. Another possible explanation is that the observed age difference could be attributed to mass transfer between the binary system's two components. In both cases, the assumption of single star evolution for both components is unjustified, except when the interaction happened already in the earliest MS phase. More investigation is needed to put constraints on this. However, we note that the scope of this project is to test the TCM1. We find that again we obtain the same result with the TCM1 as the typical MLT plus overshooting approach, and that our results are consistent with Neilson et al. (2015).
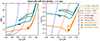 |
Fig. 5. Same as Fig. 4, but for the OGLE-LMC-CEP-1812 system. This figure is discussed in detail in Sect. 5.2. |
5.3. OGLE-LMC-CEP-4506
This highly excentric binary system was analyzed by Gieren et al. (2015)2. While both companions appear to be in the IS, the secondary with a mass of 3.52 M⊙ is not pulsating. The primary is a slightly more massive Cepheïd of 3.61 M⊙. Both components have very similar effective temperatures3, determined by Pilecki et al. (2018) to be 6120±160 K and 6070±150 K, for the primary and secondary, respectively. We computed the evolution for each of the stars in the OGLE-LMC-CEP-4506 system with initial masses of 3.63 M⊙ (Cepheïd) and 3.54 M⊙ (non-pulsating companion), and a metallicity [Fe/H] of −0.5 (Fig. 6). The slightly more massive primary appears to be located on the upper branch of the blue loop (see in particular the left panel of Fig. 6), and is therefore more evolved, as to be expected. Gieren et al. (2015) modeled this system using MLT plus overshooting and found a similar result, but speculate that a better determination of Teff could place the secondary outside the red edge of the IS. This appears to be unlikely, as the observed temperature is too high and the later re-determination by Pilecki et al. (2018) basically confirmed the earlier values, although, due to the very long orbital period of 1550 days, acquiring well-distributed spectroscopic data presents a significant challenge. Further observations are probably needed for this system to put precise constraints on its stellar parameters (Pilecki et al. 2018). Our chosen metallicity is identical to the one used by Pilecki et al. (2018), although it appears to be too low compared to the average LMC value of [Fe/H]=−0.42 by Choudhury et al. (2021). The best-fit models from this set of tracks exhibit luminosities that are approximately ∼2σ lower than the observed values. Therefore, we further computed another set of evolutionary tracks with the same initial masses but with an even lower metallicity value of −0.6 (Fig. D.2). We obtained a marginally lower χ2 for this set of calculation, but otherwise the same result. In both cases, the best-fitting models differ by about 6% in age, which is slightly more than the range allowed by the uncertainty in mass (1% for both stars).
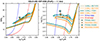 |
Fig. 6. Same as Fig. 4, but for OGLE-LMC-CEP-4506 system with [Fe/H]=−0.5. This figure is discussed in detail in Sect. 5.3. |
We note that computations with MLT plus ad hoc overshooting lead to a slightly better agreement between the evolutionary tracks and the observations (see Fig. D.2) due to a larger convective core size on the MS (see Ahlborn et al. 2022, their Fig. 7). This also could be achieved in the TCM model by increasing αω, as discussed in Sect. 5.1. The difference between the tracks is however much smaller than compared to MLT without overshooting, as mentioned before.
5.4. OGLE-LMC-CEP-2532
OGLE-LMC-CEP-2532 is a binary system with a first overtone Cepheïd as the primary component and a non-pulsating star as the secondary component. Its orbit was first analysed by Pilecki et al. (2015) and later revised by Pilecki et al. (2018). We used the latter results for the stellar parameters. The Cepheïd in this system has the most accurate dynamical mass (3.98±0.10 M⊙) determined for a first overtone Cepheïd. The secondary, non-pulsating companion is slightly less massive (3.94±0.09 M⊙), although within the errors, their masses could also be equal. We adopted initial masses of 4.05 M⊙ and 3.95 M⊙, respectively, and as before two metallicity values: [Fe/H] of −0.5 and −0.6 (see Table 6). The tracks corresponding to −0.5 are shown in Fig. 7, and those for −0.6 are shown in Fig. D.3. Both stars can be modeled almost exactly in the corresponding R-Teff and HR diagrams. The primary is already on the third crossing of the blue loop for both sets of models. For the lower metallicity, [Fe/H]=−0.6, the secondary is still on the lower RGB, at the onset of core He-burning. For [Fe/H]=−0.5 it may be in this phase, too, or has already entered the lower branch of the loop. The evolutionary age differences of the two components of the best-fitting models are ∼1 and 7 Myrs, respectively, for the higher and lower metallicity. This is well within the mass uncertainty. The χ2 value is found to be minimal for [Fe/H] = −0.5. This is one of the best theory-consistent systems in this work.
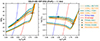 |
Fig. 7. Same as Fig. 4, but for the OGLE-LMC-CEP-2532 system, for a metallicity of [Fe/H]=−0.5. This figure is discussed in detail in Sect. 5.4. |
5.5. OGLE-LMC-CEP-1718
OGLE-LMC-CEP-1718 consists of two first-overtone (FO) Cepheïds. It was first detected by Soszyński et al. (2008) and spectroscopically confirmed by Gieren et al. (2014). It is the first ever detected binary system which consists of two FO Cepheïds, and presents a unique opportunity to test both evolutionary and pulsation models. Here, the primary component is slightly more massive than the secondary 4.27 vs. 4.22 M⊙, yet both have similar effective temperatures, being within 40 K at an uncertainty of 150 K (see Table 7). Interestingly, the secondary component exhibits higher luminosity than the primary, which suggests that the secondary, despite its lower mass, is in a more advanced evolutionary stage. This again contradicts basic stellar physics, where the more massive star is expected to evolve more quickly. However, within the quoted mass uncertainty of 0.04 M⊙ the mass hierarchy could also be inverted, reconciling observations with theoretical expectations for the evolution of two non-interacting single stars.
For this system, we adopted initial masses of 4.28 M⊙ and 4.24 M⊙, and considered three metallicity values: [Fe/H] = −0.5, −0.6 and −0.3 (the motivation for the highest value is given below). The evolutionary tracks corresponding to these metallicities are shown in Figs. 8, D.4 and D.5, respectively. While the secondary component's observed parameters align well with theoretical predictions with metallicity [Fe/H] = −0.6, there is a mismatch in radius and luminosity between the observed and predicted parameters for the primary Cepheïd. Increasing the metallicity will shift the evolutionary track to lower luminosity thereby reducing the difference between observation and models. The result of this calculation is shown in Appendix D.5. We note that in all three metallicity cases, the observed parameters are recovered within 2σ. However, the age differences are incompatible with the uncertainties in mass for all metallicities, but lowest in the [Fe/H] = −0.3 case (Table 7).
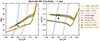 |
Fig. 8. Same as Fig. 7, but for the OGLE-LMC-CEP-1718 system with [Fe/H]=−0.5. This figure is discussed in detail in Sect. 5.5. |
The radius or luminosity difference between the two objects is too large to assume that they are both in the blue loop phase, but in different crossings, as the lower and upper branches are too close to each other at the objects’ temperature. Rather, radii or luminosities suggest that one star is on the first crossing, and the other one in the loop. Furthermore, the secondary is moving blueward, based on period change measurements (Pilecki et al. 2018), which is a further indication that the secondary is actually on the second crossing (lower loop branch). Together with a mass inversion, this would yield consistency with theory. For the lowest metallicity, [Fe/H] = −0.6, we indeed find that one star is on the first crossing, while the other is in the loop (Fig. D.4). Pilecki et al. (2018) also commented on this problem, suggesting physical effects like rotation or overshooting as possible solutions. However, given the very similar masses, such physical effects should be similar in both stars.
These problems may stem from the complex nature of the system, as both components are pulsating variables, making light curve modeling particularly challenging. Additionally, the system presents further difficulty since only one shallow eclipse is visible in each cycle. As a result, the parameters derived from light curve modeling rely on several assumptions and are subject to significant uncertainty.
6. Summary and discussion
The evolutionary tracks, particularly the blue loops and luminosity levels of Cepheïds, are highly sensitive to variations of the model parameters and assumptions set on the input physics. As is known and as we have shown, CBM is a crucial process that needs to be included in evolutionary models to successfully model Cepheids, particularly for reproducing the correct luminosity at a given stellar mass. In general, MLT plus overshooting models are adequate for predicting the observations of Cepheïds. However, the exact amount of overshooting required to explain individual cases remains uncertain and the free parameter in the overshooting prescription needs to be determined. Our aim in this study was to improve the modeling of convection and to provide a more physically grounded approach to treating nonlocality. We have included slight mass loss in our models, but we have not concentrated on varying its amount, nor considered other potentially influential effects such as rotation.
While the mass and radius of the five Cepheïd systems we modeled are known with a high level of precision, their metallicity is rather uncertain. The influence of metallicity is demonstrated in the top left panel of Fig. 9, where we present the evolutionary tracks for a 5 M⊙ star corresponding to three different metallicity values ([Fe/H]=−0.6,−0.3,0.0). Metallicity has a significant impact on the luminosity of the tracks, the temperature along the RGB, and the extent of the blue loops, particularly when we transition from the metal-poor to the metal-rich models (from [Fe/H]=−0.6 to 0.0). These effects mainly originate from the evolution on the main sequence, where more metal-rich stars are cooler and fainter than their metal-poor counterparts, due to the higher opacities. This well-known and global effect pertains throughout the evolution and explains the trends seen in the upper left panel of Fig. 9: the RGB parts of more metal-poor models are slightly hotter, loops more extended, while the radii somewhat larger. However, the influence of metallicity on the details and extent of the blue loop is not as clear and not necessarily monotonic (Salaris & Cassisi 2005, cf. their Figs. 6.10 and 6.11). As an example, we refer to the discussion in Sect. 5.5, where a higher metallicity than usually assumed leads to a fainter track, locates the Cepheïd component on the second crossing and thereby allows for a better fit (compare Figs. 8 and D.5). Understanding the details of the influence of metallicity will require a detailed investigation, which is beyond the scope of this work. Nonetheless, the evolution of Cepheïds during core helium burning is obviously highly sensitive to their metallicity.
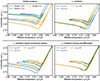 |
Fig. 9. Evolutionary tracks of a 5 M⊙ Cepheïd for varying metallicity, dissipation length parameter, αΛ, and nonlocal parameter, αω. The variations of the metallicity and αΛ are shown in the top left and right panel, respectively. In the lower left panel, αω is varied in the whole evolution of the star, while in the lower right panel, αω is only varied in the post-main sequence evolution. Parameters other than the ones indicated are kept at their default values. |
We also tested the influence of the parameters of TCM1 (see Sect. 2.1). In the top right panel of Fig. 9, we present the evolutionary tracks for a 5 M⊙ star with [Fe/H] = 0.0 by varying the αΛ parameter. This parameter has very little impact on the extent and luminosity of the blue loops. It mainly increases the RGB temperature as we increase the value of αΛ. This is similar to the effect of the mixing-length parameter of MLT models. Next, we show the impact of αω on the evolutionary track of a 5 M⊙ star with [Fe/H] = 0.0 in the lower panels of Fig. 9. This parameter determines the extent of the overshooting region as it indicates the impact of the nonlocal flux of the TKE (Ahlborn et al. 2022). Hence, this parameter has a strong influence on the extent and luminosity level of the blue loops (lower left panel). Larger αω values lead to a larger core and an overall higher luminosity. It also decreases the extent of the blue loop. This behavior is analogous to the effects of the overshooting parameter in MLT models. The extent of the blue loop can be primarily characterized by the core potential (≈core mass divided by the core radius) (Kippenhahn et al. 2013). A smaller value of this ratio results in a more extended blue loop and vice versa. Overshooting on the main sequence increases this ratio with a rising nonlocal parameter, αω, or overshooting parameter fOV and, consequently, results in a less extended blue loop. Fixing αω during the MS phase and varying it only in the post-MS phase has a minimal impact on the blue loops (lower right panel). Thus, nonlocality on the MS has the largest impact on the emergence of a blue loop. A detailed investigation of the influence of each of these parameters in the various evolutionary phases goes beyond the purpose of this study; and therefore only metallicity, as an observational parameter, was varied, when we compared our models to observed Cepheïds.
Out of the five systems tested, our models successfully reproduced the observations for OGLE-LMC-CEP-0227 and OGLE-LMC-CEP-2532. The fact that these two systems have the most precisely estimated parameters highlights the importance of observational precision for a better understanding and tighter constraints on the underlying evolutionary physics. For the other three systems, we found similar problems in obtaining the correct values from the models as reported for modeling efforts done with MLT plus overshooting.
The Cepheïd of the OGLE-LMC-CEP-1812 system is predicted to be in a very short-lived stellar evolutionary phase, which is not impossible but rather unlikely. Additionally, the less massive, non-pulsating companion is found to be in a more advanced evolutionary stage. This may point to a complex binary evolutionary scenario, potentially involving mass transfer, binary mergers, or other interactions, a detailed investigation of which is beyond the scope of this paper (Neilson et al. 2015). In this case, our treatment of two single stars evolving independently would not be applicable.
In the case of OGLE-LMC-CEP-4506, there is a possibility of a large uncertainty in estimating the effective temperature from observations due to its relatively long orbital period. Currently, the MLT plus overshooting model appears to fit this system better than TCM1, as it predicts a slightly higher luminosity. However, this conclusion is also uncertain, given the lack of precise metallicity estimates for any of the binary systems considered in this study. We discuss this further below.
Neither one of our models are able to simultaneously fit the observations for both components of OGLE-LMC-CEP-1718. Given that both stars in this system are pulsating, the complexities in their light curve modeling may have introduced uncertainty in the estimated parameters (also see Pilecki et al. 2018). A possible alternative to fitting both stars with the same metallicity (∼−0.3 as in Fig. D.5) involves widening the gap between the second and third crossings in terms of luminosity. This could be achieved with a suitable choice of free parameters in TCM1. As shown in Fig. 3, considering nonlocality in different regions of the stars alters this gap, suggesting that tuning the parameters might offer a solution. In the future, a thorough parameter study of the free parameters of the TCM1 could help in improving the models to provide a better match to observations and also to find the ideal parameter set to use with stellar models.
Another important future aspect of this study will be estimating a mass-luminosity relation for Cepheïds based on evolutionary models incorporating TCM1. This mass-luminosity relation is crucial for constructing pulsation model grids. In previous studies, the mass-luminosity relation is based on MLT plus overshooting evolutionary models (Bono et al. 2000; Anderson et al. 2014), which is a time-independent convection theory and the overshooting is an ad hoc, empirical fix for the shortcomings of the local MLT. However, for pulsation calculations, we need a nonlocal and time-dependent convection treatment. For example, MESA-RSP uses a modified version of the Kuhfuß (1986) model. As a result of these differing convection treatments, it remains challenging to directly continue pulsational model computations from the envelope of evolutionary models (Paxton et al. 2019). Moreover, the light curve structures of radially pulsating stars are highly sensitive to the convection treatment in their envelopes. In our future work, we aim to explore the integration of TCM3 into both the evolutionary and pulsation models of radially pulsating stars. We anticipate that this approach could improve our ability to model the observed properties of these stars with greater accuracy, although its effectiveness will depend on how well the TCM3 captures the underlying physical processes.
7. Conclusions
The evolutionary tracks of Cepheïds, especially the appearance of the blue loops, are highly sensitive to the input physics of the stellar models. In combination with the highly accurate observations of binary systems, this makes Cepheïds ideal laboratories to test new physics of stellar evolutionary models. In this study, we used the observations of Cepheïds in eclipsing binary systems to test the predictions of the TCM1 convection model (Kuhfuß 1986, 1987). Furthermore, we investigated the influence of CBM on the structure and evolution models of Cepheïds, by testing how the blue loop changes if we apply CBM only at specific boundaries, followed by a parameter study of the most important free parameters of the TCM1.
We show above that the solution of the TCM1 equation without any external descriptions or any finetuning of the numerical parameters involved predicts the overshooting zone beyond the Schwarzschild boundary. This leads to the emergence of blue loops in the evolutionary tracks of intermediate mass stars, which is a necessity to explain the observations of Cepheïds.
We do find that the inclusion or neglect of nonlocality at different boundaries in the post-MS evolution slightly modifies the morphology and extent of the blue loops (see Fig. 3). However, the nonlocality in the MS phase seems to be most decisive for the emergence of a blue loop. Furthermore, the model effectively constrains the temperature gradient in the overshooting zone, which the ad hoc overshooting in MLT implementation cannot predict. However, as shown by Braun et al. (2024), TCM1 struggles to accurately model the temperature stratification in the solar convective envelope. The application of TCM3 is expected to model convection more accurately in the envelopes of 1D stellar evolutionary models (Braun et al. 2024).
The problem of the “Cepheïd mass discrepancy” has long stood as a challenging puzzle in astrophysics. One proposed solution that has been put forward to solve this discrepancy concerns the size of the MS convective core (Sect. 4). Previously, this had been addressed by incorporating overshooting in an ad hoc manner (e.g., Cassisi & Salaris 2011; Prada Moroni et al. 2012). This mainly involves adjusting the overshooting parameters to match observations without considering the underlying physics of convection. The comparison of TCM1 models to the observations of five Cepheïd systems shows that TCM1 reproduces the observations with a similar level of accuracy as MLT models, including ad hoc overshooting. This is achieved without any finetuning of the TMC1 model parameters.
Comparing the evolutionary tracks in Figs. 4–8, it is apparent that the TCM1 blue loops are slightly more extended and that the luminosity of the TCM1 models is generally lower than for the MLT plus overshooting tracks. This difference increases slightly with decreasing mass, even if the mass range of the Cepheïds investigated here is rather limited. These luminosity differences could probably be minimized or even eliminated by fine-tuning the αω parameter. However, our primary focus is on reproducing the observations using the same values of the free parameters involved in TCM1, rather than adjusting them individually for each observation. Hence, we conclude that TCM1 predicts the overshooting at convective boundaries very accurately for the default parameters.
Finally, TCM1 still relies on certain assumptions about the free parameters, which are calibrated using the local and time-independent MLT plus overshooting model (e.g., Ahlborn 2022). These assumptions are not mandatory. A more effective approach to constrain these parameters would be to integrate evolutionary models with full amplitude stable mode pulsation models and compare their predictions with observations, particularly for radially pulsating stars. Additionally, carrying out a comparison as done in this work with the more physically complete TCM3 would be the next step toward improving models of convection in stellar evolution codes.
Acknowledgments
We thank the reviewer for the valuable and constructive feedback and suggestions. We express our gratitude to the Kavli Foundation and the Max Planck Institute for Astrophysics for their support of the Kavli Summer Program in Astrophysics, 2023. This program provided the environment in which a significant portion of this project was undertaken. MD thanks Marcella Marconi (Istituto Nazionale di Astrofisica, INAF – Osservatorio Astronomico di Capodimonte) for her valuable feedback and acknowledges funding from the INAF 2023 Large Grant MOVIE (PI: Marcella Marconi). FA acknowledges funding from the ERC Consolidator Grant DipolarSound (grant agreement # 101000296) and support from the Klaus Tschira foundation.
For simplicity, we use the term “nonlocal” as an abbreviation for “nonlocal model for convection in …”.
Originally called OGLE LMC 562.05.9009.
The observed effective temperature indicates the mean effective temperature over a pulsation cycle.
References
- Ahlborn, F. 2022, Dissertation, Ludwig Maximilians Universität München, München [Google Scholar]
- Ahlborn, F., Kupka, F., Weiss, A., & Flaskamp, M. 2022, A&A, 667, A97 [NASA ADS] [CrossRef] [EDP Sciences] [Google Scholar]
- Anders, E. H., Jermyn, A. S., Lecoanet, D., & Brown, B. P. 2022, ApJ, 926, 169 [NASA ADS] [CrossRef] [Google Scholar]
- Andersen, J. 1991, A&A Rev., 3, 91 [Google Scholar]
- Anderson, R. I., Ekström, S., Georgy, C., et al. 2014, A&A, 564, A100 [NASA ADS] [CrossRef] [EDP Sciences] [Google Scholar]
- Andrássy, R. 2015, Ph.D. Thesis, University of Amsterdam, Netherlands [Google Scholar]
- Bhardwaj, A., Riess, A. G., Catanzaro, G., et al. 2023, ApJ, 955, L13 [NASA ADS] [CrossRef] [Google Scholar]
- Biermann, L. 1932, ZAp, 5, 117 [NASA ADS] [Google Scholar]
- Böhm-Vitense, E. 1958, ZAp, 46, 108 [NASA ADS] [Google Scholar]
- Bono, G., Caputo, F., Cassisi, S., et al. 2000, ApJ, 543, 955 [NASA ADS] [CrossRef] [Google Scholar]
- Bono, G., Braga, V. F., & Pietrinferni, A. 2024, A&A Rev., 32, 4 [NASA ADS] [CrossRef] [Google Scholar]
- Braun, T. A. M., Ahlborn, F., & Weiss, A. 2024, A&A, 689, A292 [NASA ADS] [CrossRef] [EDP Sciences] [Google Scholar]
- Canuto, V. M. 1992, ApJ, 392, 218 [Google Scholar]
- Canuto, V. M. 1993, ApJ, 416, 331 [NASA ADS] [CrossRef] [Google Scholar]
- Canuto, V. M. 1997, ApJ, 482, 827 [Google Scholar]
- Canuto, V. M. 2011, A&A, 528, A76 [NASA ADS] [CrossRef] [EDP Sciences] [Google Scholar]
- Canuto, V. M., & Dubovikov, M. 1998, ApJ, 493, 834 [NASA ADS] [CrossRef] [Google Scholar]
- Caputo, F., Marconi, M., Musella, I., & Santolamazza, P. 2000, A&A, 359, 1059 [NASA ADS] [Google Scholar]
- Cassisi, S., & Salaris, M. 2011, ApJ, 728, L43 [NASA ADS] [CrossRef] [Google Scholar]
- Choudhury, S., de Grijs, R., Bekki, K., et al. 2021, MNRAS, 507, 4752 [CrossRef] [Google Scholar]
- Cox, A. N. 1980, ARA&A, 18, 15 [NASA ADS] [CrossRef] [Google Scholar]
- Deka, M., Bellinger, E. P., Kanbur, S. M., et al. 2024, MNRAS, 530, 5099 [Google Scholar]
- Ferguson, J. W., Alexander, D. R., Allard, F., et al. 2005, ApJ, 623, 585 [Google Scholar]
- Flaskamp, M. 2003, Ph.D. Thesis, Technical University of Munich, Germany [Google Scholar]
- Freytag, B., Ludwig, H. G., & Steffen, M. 1996, A&A, 313, 497 [NASA ADS] [Google Scholar]
- Fu, X., Bressan, A., Marigo, P., et al. 2018, MNRAS, 476, 496 [NASA ADS] [CrossRef] [Google Scholar]
- Gallenne, A., Kervella, P., Evans, N. R., et al. 2018, ApJ, 867, 121 [Google Scholar]
- Gautschy, A. 2022, arXiv e-prints [arXiv:2209.11502] [Google Scholar]
- Gieren, W., Pilecki, B., Pietrzyński, G., et al. 2014, ApJ, 786, 80 [NASA ADS] [CrossRef] [Google Scholar]
- Gieren, W., Pilecki, B., Pietrzyński, G., et al. 2015, ApJ, 815, 28 [NASA ADS] [CrossRef] [Google Scholar]
- Grevesse, N., & Sauval, A. J. 1998, Space Sci. Rev., 85, 161 [Google Scholar]
- Halabi, G. M., El Eid, M. F., & Champagne, A. 2012, ApJ, 761, 10 [NASA ADS] [CrossRef] [Google Scholar]
- Higgins, E. R., & Vink, J. S. 2023, MNRAS, 518, 1158 [Google Scholar]
- Hinshaw, G., Larson, D., Komatsu, E., et al. 2013, ApJS, 208, 19 [Google Scholar]
- Huang, R. Q., & Weigert, A. 1983, A&A, 127, 309 [NASA ADS] [Google Scholar]
- Iben, I. Jr. 1972, ApJ, 178, 433 [Google Scholar]
- Iglesias, C. A., & Rogers, F. J. 1993, ApJ, 412, 752 [Google Scholar]
- Iglesias, C. A., & Rogers, F. J. 1996, ApJ, 464, 943 [NASA ADS] [CrossRef] [Google Scholar]
- Joyce, M., & Chaboyer, B. 2015, ApJ, 814, 142 [Google Scholar]
- Keller, S. C. 2008, ApJ, 677, 483 [NASA ADS] [CrossRef] [Google Scholar]
- Kippenhahn, R., Weigert, A., & Weiss, A. 2013, Stellar Structure and Evolution (Berlin, Heidelberg: Springer, Berlin Heidelberg) [Google Scholar]
- Kuhfuß, R. 1986, A&A, 160, 116 [NASA ADS] [Google Scholar]
- Kuhfuß, R. 1987, Ph.D. Thesis, Technical University of Munich, Germany [Google Scholar]
- Kupka, F., Ahlborn, F., & Weiss, A. 2022, A&A, 667, A96 [NASA ADS] [CrossRef] [EDP Sciences] [Google Scholar]
- Lauterborn, D., Refsdal, S., & Weigert, A. 1971, A&A, 10, 97 [NASA ADS] [Google Scholar]
- Leavitt, H. S. 1908, Ann. Harv. College Obs., 60, 87 [NASA ADS] [Google Scholar]
- Leavitt, H. S., & Pickering, E. C. 1912, Harv. College Obs. Circ., 173, 1 [Google Scholar]
- Li, Y., & Yang, J. Y. 2007, MNRAS, 375, 388 [NASA ADS] [CrossRef] [Google Scholar]
- Magic, Z., Serenelli, A., Weiss, A., & Chaboyer, B. 2010, ApJ, 718, 1378 [NASA ADS] [CrossRef] [Google Scholar]
- Marconi, M., Molinaro, R., Bono, G., et al. 2013, ApJ, 768, L6 [Google Scholar]
- Miller, C. L., Neilson, H. R., Evans, N. R., Engle, S. G., & Guinan, E. 2020, ApJ, 896, 128 [Google Scholar]
- Neilson, H. R., Cantiello, M., & Langer, N. 2011, A&A, 529, L9 [NASA ADS] [CrossRef] [EDP Sciences] [Google Scholar]
- Neilson, H. R., Langer, N., Engle, S. G., Guinan, E., & Izzard, R. 2012, ApJ, 760, L18 [NASA ADS] [CrossRef] [Google Scholar]
- Neilson, H. R., Izzard, R. G., Langer, N., & Ignace, R. 2015, A&A, 581, L1 [NASA ADS] [CrossRef] [EDP Sciences] [Google Scholar]
- Paterno, L., Ventura, R., Canuto, V. M., & Mazzitelli, I. 1993, ApJ, 402, 733 [Google Scholar]
- Paxton, B., Smolec, R., Schwab, J., et al. 2019, ApJS, 243, 10 [Google Scholar]
- Pietrinferni, A., Cassisi, S., Salaris, M., & Castelli, F. 2004, ApJ, 612, 168 [Google Scholar]
- Pietrzyński, G., Thompson, I. B., Gieren, W., et al. 2010, Nature, 468, 542 [CrossRef] [Google Scholar]
- Pietrzyński, G., Thompson, I. B., Graczyk, D., et al. 2011, ApJ, 742, L20 [CrossRef] [Google Scholar]
- Pilecki, B., Graczyk, D., Pietrzyński, G., et al. 2013, MNRAS, 436, 953 [NASA ADS] [CrossRef] [Google Scholar]
- Pilecki, B., Graczyk, D., Gieren, W., et al. 2015, ApJ, 806, 29 [NASA ADS] [CrossRef] [Google Scholar]
- Pilecki, B., Gieren, W., Pietrzyński, G., et al. 2018, ApJ, 862, 43 [NASA ADS] [CrossRef] [Google Scholar]
- Prada Moroni, P. G., Gennaro, M., Bono, G., et al. 2012, ApJ, 749, 108 [NASA ADS] [CrossRef] [Google Scholar]
- Reimers, D. 1975, Memoires of the Societe Royale des Sciences de Liege, 8, 369 [Google Scholar]
- Reimers, D. 1977, A&A, 61, 217 [NASA ADS] [Google Scholar]
- Robertson, J. W. 1971, ApJ, 170, 353 [Google Scholar]
- Robertson, J. W. 1972, ApJ, 177, 473 [Google Scholar]
- Romaniello, M., Riess, A., Mancino, S., et al. 2022, A&A, 658, A29 [NASA ADS] [CrossRef] [EDP Sciences] [Google Scholar]
- Salaris, M., & Cassisi, S. 2005, Evolution of Stars and Stellar Populations (Wiley-VCH) [Google Scholar]
- Soszyński, I., Poleski, R., Udalski, A., et al. 2008, Acta Astron., 58, 163 [NASA ADS] [Google Scholar]
- Stellingwerf, R. F. 1982, ApJ, 262, 330 [NASA ADS] [CrossRef] [Google Scholar]
- Stobie, R. S. 1969, MNRAS, 144, 485 [NASA ADS] [Google Scholar]
- Straka, C. W., Demarque, P., & Guenther, D. B. 2005, ApJ, 629, 1075 [CrossRef] [Google Scholar]
- Troisi, F., Bono, G., Stetson, P. B., et al. 2011, PASP, 123, 879 [Google Scholar]
- Weiss, A., & Schlattl, H. 2008, Ap&SS, 316, 99 [CrossRef] [Google Scholar]
- Wuchterl, G. 1995, Comput. Phys. Commun., 89, 119 [NASA ADS] [CrossRef] [Google Scholar]
- Wuchterl, G., & Feuchtinger, M. U. 1998, A&A, 340, 419 [NASA ADS] [Google Scholar]
- Xiong, D. -R. 1978, Chin. Astron., 2, 118 [NASA ADS] [CrossRef] [Google Scholar]
- Xiong, D. -R. 1986, A&A, 167, 239 [NASA ADS] [Google Scholar]
- Xu, H. Y., & Li, Y. 2004, A&A, 418, 213 [NASA ADS] [CrossRef] [EDP Sciences] [Google Scholar]
- Zhao, L., Song, H., Meynet, G., et al. 2023, A&A, 674, A92 [NASA ADS] [CrossRef] [EDP Sciences] [Google Scholar]
Appendix A: Chemical composition
All the [Fe/H] values and the corresponding X, Y and Z adopted in this work are given in Table A.1.
Chemical compositions of the adopted models.
Appendix B: Stellar parameters for the binary systems considered in this work
The stellar parameters of the binary systems obtained from the literature are given in Table B.1. We chose five of the systems described by Pilecki et al. (2013) and Pilecki et al. (2018) to test the TCM1 and have included them in the table.
Properties of the eclipsing binary systems obtained from the literature.
Appendix C: Evolutionary tracks for OGLE-LMC-CEP-0227 with inverted mass ratio
Fig. C.1 presents the evolutionary tracks for OGLE-LMC-CEP-0227, plotted with inverted mass ratio compared to the observations, as discussed in Sect. 5.1.
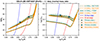 |
Fig. C.1. Alternate models for OGLE-LMC-CEP-0227 by assigning inverted mass to primary and secondary components. This figure is discussed in detail in Sect. 5.1. |
Appendix D: Evolutionary tracks with different metallicities
This section provides supplementary figures (Figs. D.1 – D.5) of the evolutionary tracks of the observed binary systems with different metallicities as discussed in Sect. 5.
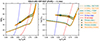 |
Fig. D.1. Same as Fig. 4, but with different [Fe/H] value (−0.6). Some error bars are smaller than the symbols. This figure is discussed in detail in Sect. 5.1. |
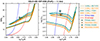 |
Fig. D.2. Same as Fig. 6, but with a different metallicity, [Fe/H]=−0.6. This figure is discussed in detail in Sect. 5.3. |
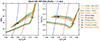 |
Fig. D.3. Same as Fig. 7, but with a different metallicity, [Fe/H]=−0.6. This figure is discussed in detail in Sect. 5.4. |
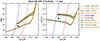 |
Fig. D.4. Same as Fig. 8, but with a different metallicity, [Fe/H]=−0.6. This figure is discussed in detail in Sect. 5.5. |
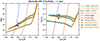 |
Fig. D.5. Same as Fig. 8, but with a different metallicity, [Fe/H]=−0.3. This figure is discussed in detail in Sect. 5.5. |
All Tables
Summary of the cases with CBM at different boundaries during the core He-burning phase.
Stellar parameters obtained for the components of the OGLE LMC-CEP-0227 system from the evolutionary tracks are listed below.
Stellar parameters obtained for the components of the OGLE LMC-CEP-1812 system from the evolutionary tracks are listed below.
Stellar parameters obtained for the components of the OGLE LMC-CEP-4506 system from the evolutionary tracks are listed below.
Stellar parameters obtained for the components of the OGLE LMC-CEP-2532 system from the evolutionary tracks are listed below.
Stellar parameters obtained for the components of the OGLE LMC-CEP-1718 system from the evolutionary tracks are listed below.
All Figures
|
Fig. 1. Comparison of the evolutionary tracks for a 5 M⊙ star from the Zero-Age Main Sequence to the core He-burning phase. The tracks are computed using GARSTEC with three different convection treatments: MLT only (gray), MLT with ad hoc overshooting (orange), and Kuhfuss 1-equation TCM (cyan). The blue and red lines represent the theoretical blue and red edges of the instability strip, respectively, as estimated by Deka et al. (2024). The black dot represents a model with a central helium abundance of 0.6, whose turbulent kinetic energy profile is shown in Fig. 2. |
| In the text | |
|
Fig. 2. Top: Turbulent kinetic energy profile as a function of fractional mass for an evolutionary model of a 5 M⊙ star computed using the TCM1 with a central helium abundance of Yc = 0.6. Bottom: Temperature gradient of the model (∇model, blue dashed line). The purple and orange lines indicate the radiative ∇rad and adiabatic ∇ad temperature gradients, respectively. The vertical gray dashed line denotes the Schwarzschild boundary. |
| In the text | |
|
Fig. 3. Influence of convective boundary mixing at different boundaries during the core He-burning phase on the blue loops of a 5 M⊙ star. During the previous central hydrogen-burning phase the nonlocal TCM1 was applied. The four cases I-IV are indicated above the corresponding panel. The blue and red lines represent the blue and red edges of the instability strip, respectively, as estimated by Deka et al. (2024). The core He-burning region is color mapped by age. The green solid and dashed lines indicate the evolutionary tracks with and without nonlocality applied to the entire evolution of the star, respectively. |
| In the text | |
|
Fig. 4. Evolutionary tracks for OGLE-LMC-CEP-0227 computed using both MLT plus ad hoc overshooting (dashed lines) and TCM1 (solid lines). The left panel shows the tracks in the radius–effective temperature (RTeff) plane, while the right panel shows them in the luminosity–effective temperature (LTeff) plane. The observed positions in each plane are indicated by the colored stars (green for the primary, orange for the secondary). The best-fitting models are shown by colored circles. The observational error bars are indicated in this and all other plots, but are often comparable to or even smaller than the symbols, in particular in the (RTeff) plane. The blue and red lines in this plot represent the first overtone Cepheïd blue and red edges taken from Deka et al. (2024). This figure is discussed in detail in Sect. 5.1. |
| In the text | |
|
Fig. 5. Same as Fig. 4, but for the OGLE-LMC-CEP-1812 system. This figure is discussed in detail in Sect. 5.2. |
| In the text | |
|
Fig. 6. Same as Fig. 4, but for OGLE-LMC-CEP-4506 system with [Fe/H]=−0.5. This figure is discussed in detail in Sect. 5.3. |
| In the text | |
|
Fig. 7. Same as Fig. 4, but for the OGLE-LMC-CEP-2532 system, for a metallicity of [Fe/H]=−0.5. This figure is discussed in detail in Sect. 5.4. |
| In the text | |
|
Fig. 8. Same as Fig. 7, but for the OGLE-LMC-CEP-1718 system with [Fe/H]=−0.5. This figure is discussed in detail in Sect. 5.5. |
| In the text | |
|
Fig. 9. Evolutionary tracks of a 5 M⊙ Cepheïd for varying metallicity, dissipation length parameter, αΛ, and nonlocal parameter, αω. The variations of the metallicity and αΛ are shown in the top left and right panel, respectively. In the lower left panel, αω is varied in the whole evolution of the star, while in the lower right panel, αω is only varied in the post-main sequence evolution. Parameters other than the ones indicated are kept at their default values. |
| In the text | |
|
Fig. C.1. Alternate models for OGLE-LMC-CEP-0227 by assigning inverted mass to primary and secondary components. This figure is discussed in detail in Sect. 5.1. |
| In the text | |
|
Fig. D.1. Same as Fig. 4, but with different [Fe/H] value (−0.6). Some error bars are smaller than the symbols. This figure is discussed in detail in Sect. 5.1. |
| In the text | |
|
Fig. D.2. Same as Fig. 6, but with a different metallicity, [Fe/H]=−0.6. This figure is discussed in detail in Sect. 5.3. |
| In the text | |
|
Fig. D.3. Same as Fig. 7, but with a different metallicity, [Fe/H]=−0.6. This figure is discussed in detail in Sect. 5.4. |
| In the text | |
|
Fig. D.4. Same as Fig. 8, but with a different metallicity, [Fe/H]=−0.6. This figure is discussed in detail in Sect. 5.5. |
| In the text | |
|
Fig. D.5. Same as Fig. 8, but with a different metallicity, [Fe/H]=−0.3. This figure is discussed in detail in Sect. 5.5. |
| In the text | |
Current usage metrics show cumulative count of Article Views (full-text article views including HTML views, PDF and ePub downloads, according to the available data) and Abstracts Views on Vision4Press platform.
Data correspond to usage on the plateform after 2015. The current usage metrics is available 48-96 hours after online publication and is updated daily on week days.
Initial download of the metrics may take a while.