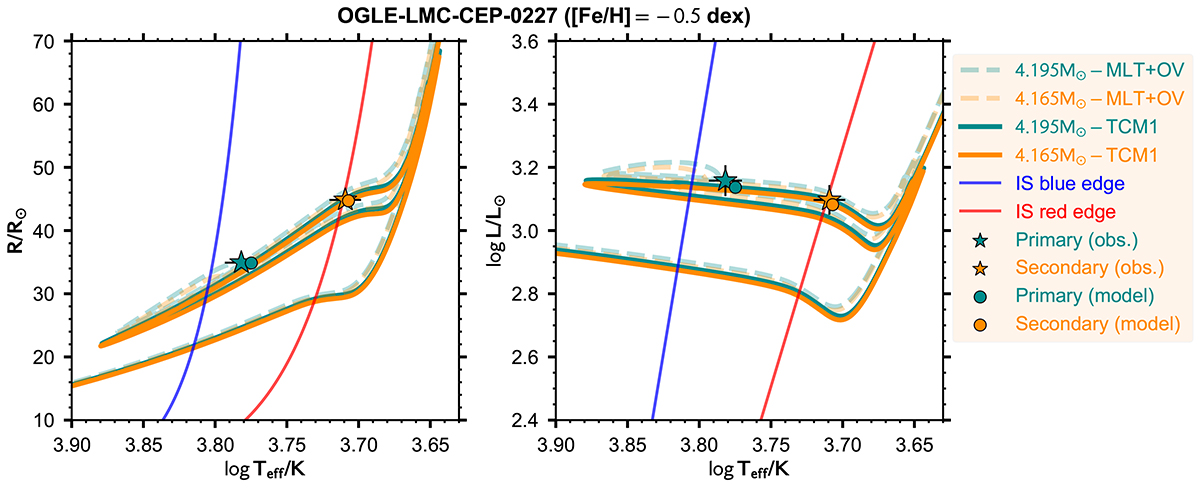
Fig. 4.
Download original image
Evolutionary tracks for OGLE-LMC-CEP-0227 computed using both MLT plus ad hoc overshooting (dashed lines) and TCM1 (solid lines). The left panel shows the tracks in the radius–effective temperature (RTeff) plane, while the right panel shows them in the luminosity–effective temperature (LTeff) plane. The observed positions in each plane are indicated by the colored stars (green for the primary, orange for the secondary). The best-fitting models are shown by colored circles. The observational error bars are indicated in this and all other plots, but are often comparable to or even smaller than the symbols, in particular in the (RTeff) plane. The blue and red lines in this plot represent the first overtone Cepheïd blue and red edges taken from Deka et al. (2024). This figure is discussed in detail in Sect. 5.1.
Current usage metrics show cumulative count of Article Views (full-text article views including HTML views, PDF and ePub downloads, according to the available data) and Abstracts Views on Vision4Press platform.
Data correspond to usage on the plateform after 2015. The current usage metrics is available 48-96 hours after online publication and is updated daily on week days.
Initial download of the metrics may take a while.