Fig. 2.
Download original image
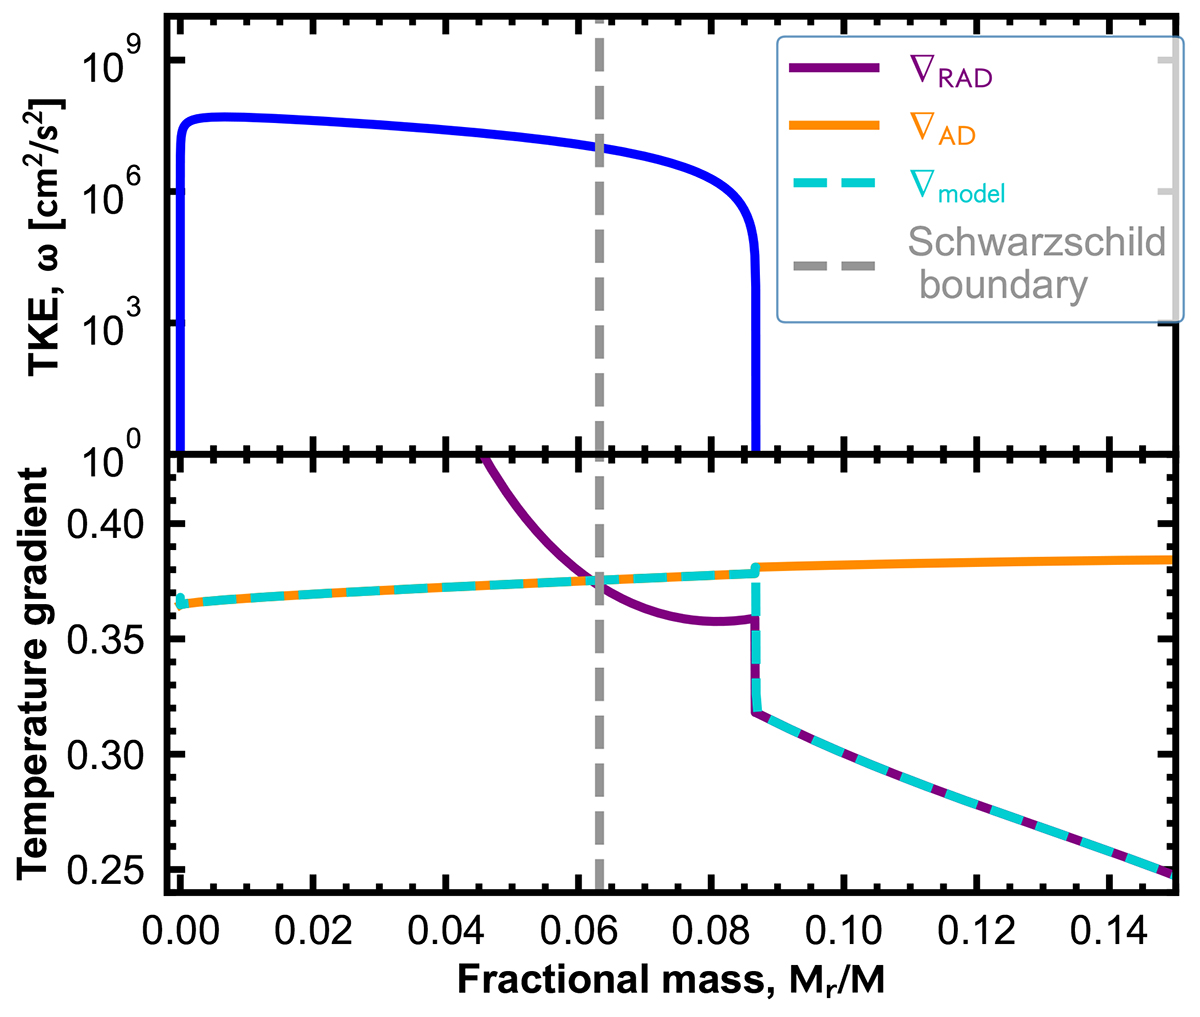
Top: Turbulent kinetic energy profile as a function of fractional mass for an evolutionary model of a 5 M⊙ star computed using the TCM1 with a central helium abundance of Yc = 0.6. Bottom: Temperature gradient of the model (∇model, blue dashed line). The purple and orange lines indicate the radiative ∇rad and adiabatic ∇ad temperature gradients, respectively. The vertical gray dashed line denotes the Schwarzschild boundary.
Current usage metrics show cumulative count of Article Views (full-text article views including HTML views, PDF and ePub downloads, according to the available data) and Abstracts Views on Vision4Press platform.
Data correspond to usage on the plateform after 2015. The current usage metrics is available 48-96 hours after online publication and is updated daily on week days.
Initial download of the metrics may take a while.