Fig. 3.
Download original image
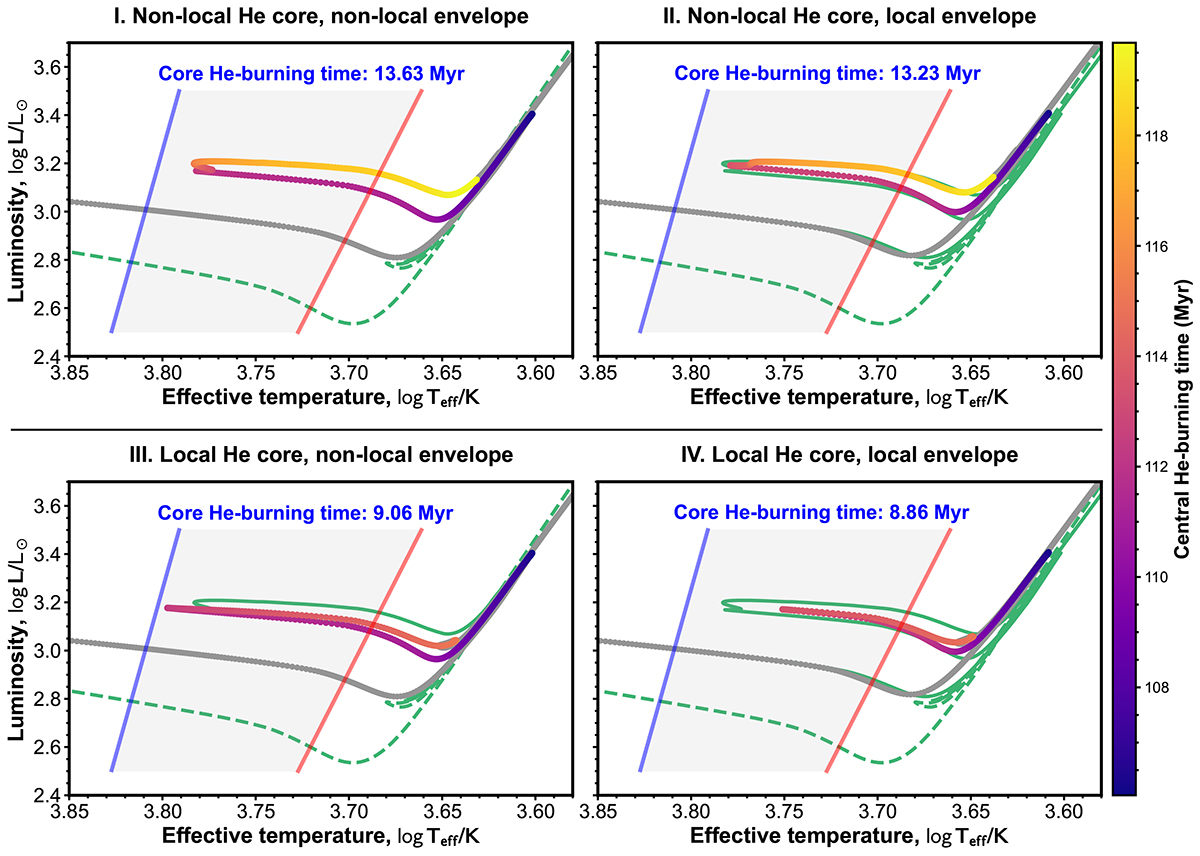
Influence of convective boundary mixing at different boundaries during the core He-burning phase on the blue loops of a 5 M⊙ star. During the previous central hydrogen-burning phase the nonlocal TCM1 was applied. The four cases I-IV are indicated above the corresponding panel. The blue and red lines represent the blue and red edges of the instability strip, respectively, as estimated by Deka et al. (2024). The core He-burning region is color mapped by age. The green solid and dashed lines indicate the evolutionary tracks with and without nonlocality applied to the entire evolution of the star, respectively.
Current usage metrics show cumulative count of Article Views (full-text article views including HTML views, PDF and ePub downloads, according to the available data) and Abstracts Views on Vision4Press platform.
Data correspond to usage on the plateform after 2015. The current usage metrics is available 48-96 hours after online publication and is updated daily on week days.
Initial download of the metrics may take a while.