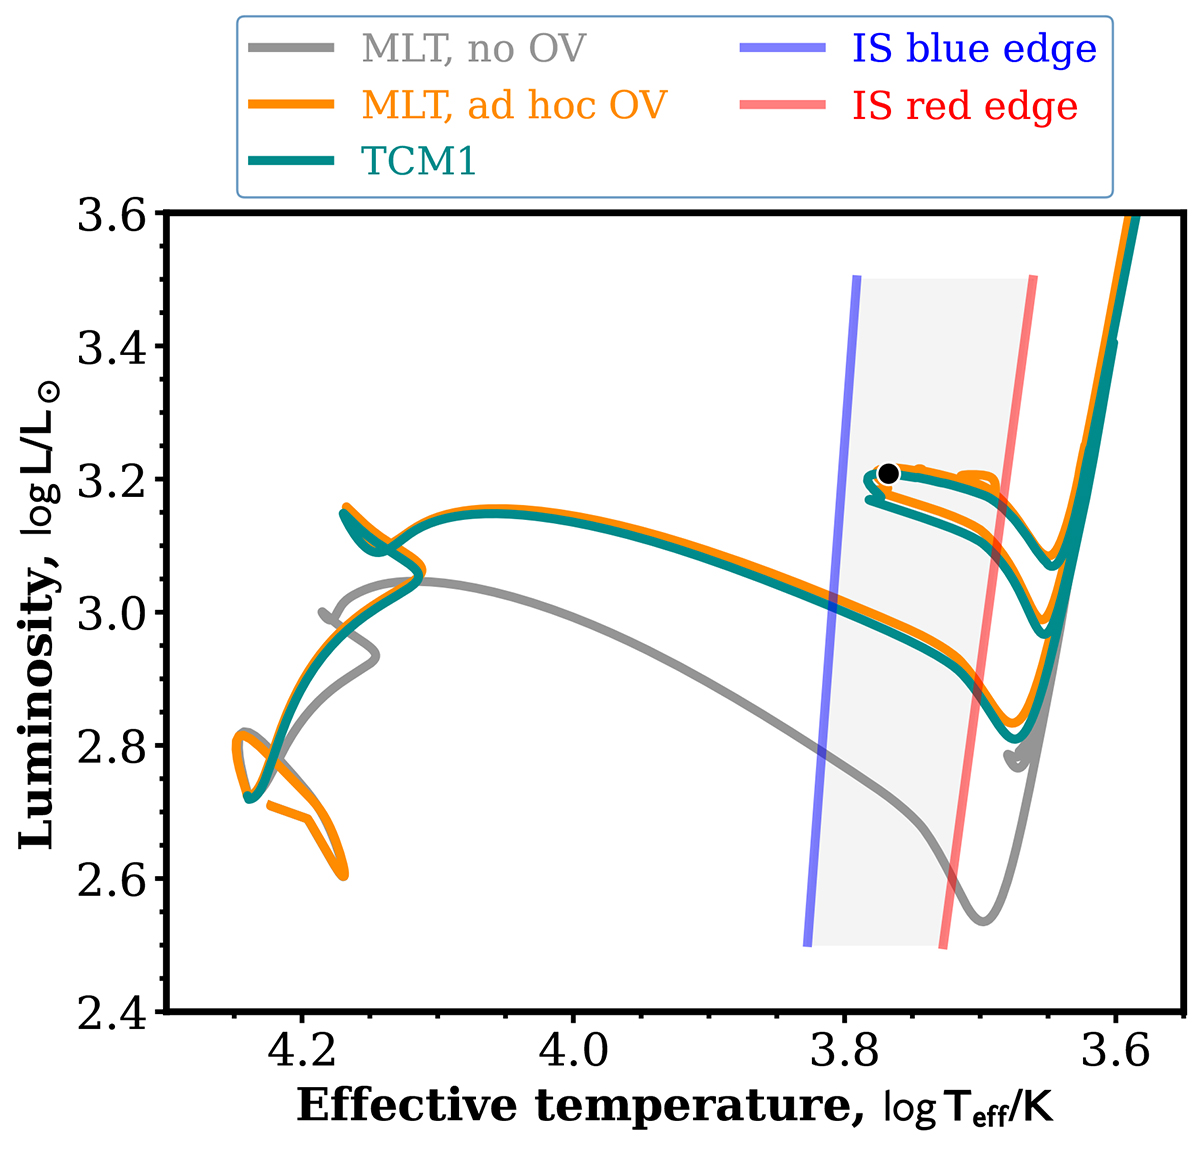
Fig. 1.
Download original image
Comparison of the evolutionary tracks for a 5 M⊙ star from the Zero-Age Main Sequence to the core He-burning phase. The tracks are computed using GARSTEC with three different convection treatments: MLT only (gray), MLT with ad hoc overshooting (orange), and Kuhfuss 1-equation TCM (cyan). The blue and red lines represent the theoretical blue and red edges of the instability strip, respectively, as estimated by Deka et al. (2024). The black dot represents a model with a central helium abundance of 0.6, whose turbulent kinetic energy profile is shown in Fig. 2.
Current usage metrics show cumulative count of Article Views (full-text article views including HTML views, PDF and ePub downloads, according to the available data) and Abstracts Views on Vision4Press platform.
Data correspond to usage on the plateform after 2015. The current usage metrics is available 48-96 hours after online publication and is updated daily on week days.
Initial download of the metrics may take a while.