| Issue |
A&A
Volume 699, July 2025
|
|
|---|---|---|
| Article Number | A136 | |
| Number of page(s) | 12 | |
| Section | Galactic structure, stellar clusters and populations | |
| DOI | https://doi.org/10.1051/0004-6361/202452883 | |
| Published online | 04 July 2025 | |
Exploring non-thermal emission from the star-forming region NGC 3603 through a realistic modelling of its environment
1
Universität Innsbruck, Institut für Astro- und Teilchenphysik,
Technikerstr. 25/8,
6020
Innsbruck,
Austria
2
Dipartimento di Fisica, Università di Trieste,
34127
Trieste,
Italy
3
Istituto Nazionale di Fisica Nucleare,
Sezione di Trieste,
34127
Trieste,
Italy
⋆ Corresponding author: This email address is being protected from spambots. You need JavaScript enabled to view it.
Received:
5
November
2024
Accepted:
1
May
2025
Abstract
Context. Star-forming regions are garnering considerable interest among the high-energy astrophysics community thanks to their potential as possible Galactic particle accelerators. In general, the role of electrons has not been fully considered in this kind of cosmic-ray source. However, the intense radiation fields inside these regions could make electrons significant gamma-ray contributors.
Aims. Our intention is to test whether its gamma-ray emission can be produced by cosmic-ray electrons by studying the young and compact star-forming region NGC 3603, a well known gamma-ray emitter.
Methods. We built a novel model by creating realistic 3D distributions of the gas and the radiation field in the region. We introduced these models into the PICARD code to perform cosmic-ray transport simulations and produce gamma-ray emission maps. We compared the results compared with a dedicated Fermi Large Area Telescope data analysis at high energies. We also explored the radio and neutrino emissions of the system.
Results. We improved the existing upper limits of the NGC 3603 gamma-ray source extension. Although the gamma-ray spectrum is aptly reproduced with the injection of CR protons, it requires a nearly 30% acceleration efficiency. In addition, the resulting extension of the simulated hadronic source is in mild tension with the extension data upper limit. The radio data disfavour the lepton-only scenario. Finally, after combining both populations, we find results that are consistent with all the observables, although the exact contributions remain ambiguous.
Key words: acceleration of particles / astroparticle physics / open clusters and associations: individual: NGC 3603 / gamma rays: stars
© The Authors 2025
 Open Access article, published by EDP Sciences, under the terms of the Creative Commons Attribution License (https://creativecommons.org/licenses/by/4.0), which permits unrestricted use, distribution, and reproduction in any medium, provided the original work is properly cited.
This article is published in open access under the Subscribe to Open model. This email address is being protected from spambots. You need JavaScript enabled to view it. to support open access publication.
1 Introduction
The origin of cosmic rays has been an intriguing question since their discovery in the early 20th century. The most accepted scenario for Galactic cosmic rays (CR) places their origin in supernova remnants (SNRs). However, this scenario faces challenges when we attempt to explain some aspects of the data that are presently available (Gabici et al. 2019). For example, the maximum energy usually attributed to Galactic cosmic rays (i.e. a few PeV) is only achievable in SNRs with specific characteristics and having highly enhanced magnetic fields (Lagage & Cesarsky 1983; Bell 2004; Cristofari et al. 2020). Another problem in this standard scenario is the chemical composition of cosmic rays. The SNR origin cannot account for the overabundance of some isotopes measured in the cosmic-ray spectrum at Earth, such as 22Ne, which is only significantly produced in Wolf-Rayet (WR) stars (Higdon & Lingenfelter 2003). These problems have motivated searches for alternative cosmic-ray sources within the Galaxy that can help to better fit the data.
Young and compact star-forming regions were proposed long ago as possible cosmic-ray sources (Cesarsky & Montmerle 1983), but they were not taken into full consideration until the above-mentioned problems arose. These regions typically contain many massive stars, which lose material through powerful winds and form a cavity in their surrounding medium (Weaver et al. 1977; Balick et al. 1980; Gallegos-Garcia et al. 2020). In this cavity, also known as bubble, the collective winds of the stars develop a termination shock, where particles can accelerate through diffusive shock acceleration (DSA; Bykov 2014; Morlino et al. 2021).
Star-forming regions also face some difficulties in reaching PeV energies (Morlino et al. 2021; Vieu et al. 2022b), mainly due to the size of the acceleration region. Nevertheless, they can easily solve the composition problem (Binns et al. 2008; Gupta et al. 2020), since WR stars usually dominate the winds in these high-energy sources (see e.g. Menchiari et al. 2025). The number of detected systems in the gamma-ray band is rising thanks to technical improvements and the accumulation of data (e.g. Ackermann et al. 2011; Abramowski et al. 2012; H.E.S.S. Collaboration 2015; Yang et al. 2018; Abeysekara et al. 2021). Thus, there is a rising interest in attempting to understand the acceleration mechanisms that might be playing a role. For example, it is not clear whether their cosmic-ray content is dominantly hadronic or leptonic: there have been numerous studies regarding the acceleration of particles in these systems where the leptonic component is, in general, disregarded (Maurin et al. 2016; Aharonian et al. 2019; Bykov et al. 2020; Vieu et al. 2022a; Bykov & Kalyashova 2022). However, the recent Westerlund 1 measurements by H.E.S.S. (Aharonian et al. 2022) seem to be better explained using a leptonic scenario (Härer et al. 2023) for the gamma-ray origin.
In this work, we explore the non-thermal properties of NGC 3603, a young and dense star-forming region. This system has been studied in-depth over the whole electromagnetic spectrum and its physical characteristics are well determined. At a distance of ∼ 7 kpc (Moffat 1983), the region contains many young massive OB stars (Moffat et al. 1994; Sung & Bessell 2004). Furthermore, a gamma-ray source in the direction of NGC 3603 was already detected (Yang, Rui-zhi & Aharonian, Felix 2017; Saha et al. 2020), but the particle population underlying this emission is still unclear. It is also intriguing to note that even though it is one of the most dense and powerful star-forming regions in the Galaxy – and, hence, ideal for particle acceleration – its detection has not been reported by TeV instruments.
Our aim is to probe whether it is possible that gamma-ray emission from NGC 3603 is produced by cosmic-ray electrons accelerated by the star cluster. For this purpose, we built a model with realistic gas density and radiation field distributions, while previous attempts employed mean values for the whole region. This realistic modelling approach, based on multiwavelength observations, enables us to study the non-thermal morphology of the system in a more realistic way.
We made use of the PICARD code (Kissmann 2014), a cosmic-ray propagation solver usually applied to the Milky Way. We introduced our 3D distributions of the gas density and radiation fields in PICARD. We then injected and propagated the CR particles, calculated their gamma-ray products, and, finally, we made a comparison with Fermi Large Area Telescope (Fermi-LAT) data. We re-analysed this region using five more years of data with respect to the last analysis of Fermi data (Saha et al. 2020) and optimized the selection cuts for the morphological study. In addition, we also explored the radio and neutrino emissions of our scenarios, as more observables would add further constraints to our models.
The paper is organized as follows: our model is detailed in Section 2. In Section 3, we describe our analysis of Fermi-LAT gamma-ray data. We give our results in Section 4 and we end with a brief discussion and conclusions in Sections 5 and 6, respectively.
2 Model
To compute the injection and propagation of cosmic rays within the star-forming region, we made use of the PICARD code to solve the diffusion-loss equation (Ginzburg & Syrovatskii 1964; Berezinskii et al. 1990):
![Mathematical equation: $\begin{array}{*{20}{r}}{ - \vec \nabla \cdot \left( {D\vec \nabla {{\rm{\Psi }}_i} - {{\vec v}_w}{{\rm{\Psi }}_i}} \right) + \frac{\partial }{{\partial p}}\left[ {{p^2}{D_{pp}}\frac{\partial }{{\partial p}}\left( {\frac{{{{\rm{\Psi }}_i}}}{{{p^2}}}} \right)} \right]}\\{ - \frac{\partial }{{\partial p}}\left[ {\dot p{{\rm{\Psi }}_i} - \frac{p}{3}\left( {\vec \nabla \cdot {{\vec v}_w}} \right){{\rm{\Psi }}_i}} \right] = Q}\\{ + \mathop {{\sum ^}}\limits_{i < j} \left( {c\beta n{\sigma _{j \to i}} + \frac{1}{{\gamma {\tau _{j \to i}}}}} \right){{\rm{\Psi }}_j} - \left( {c\beta n{\sigma _i} + \frac{1}{{\gamma {\tau _i}}}} \right){{\rm{\Psi }}_i},}\end{array}$](/articles/aa/full_html/2025/07/aa52883-24/aa52883-24-eq1.png) (1)
(1)
where D is the spatial diffusion coefficient; ψ represents the cosmic-ray flux; vW is the wind velocity; p the momentum of the particles, Dpp is the momentum diffusion coefficient describing stochastic diffusive reacceleration (Thornbury & Drury 2014); Q the source term; c the speed of light; βc and γ are the velocity and Lorentz factor of the particles, respectively; n is the gas density; σ j→i and σi are the production and fragmentation-loss cross-section, respectively; and, finally, τ is the decay mean lifetime of the species. This equation is solved in a 3D Cartesian grid of 257×257×257 cells, with x, y, z ∈ [–64, 64] pc. The boundary condition is that the CR flux vanishes at the edge of the simulation box. The box size is chosen making sure that this boundary condition does not affect the results. The central cell in the box represents the sky position RA = 11h 15′ 05.3′′, Dec = –61° 15′ 43′′ at a distance d = 7 kpc. The energy range considered is E ∈ [100 MeV, 1 PeV], with 127 logarithmically spaced bins. To solve the propagation equation, we need to implement the astrophysical environment of the star-forming region into PICARD, as the gas and photon field distributions impact CR propagation.
2.1 Radiation field
To model a realistic radiation field, we used of a catalogue of more than 200 O stars within the NGC 3603 region and its surroundings (Drew et al. 2019), since our simulation box is bigger than the SFR itself. It contains the effective temperature and spatial coordinates for every star. As these were meant to be the main source of photons within the cluster, we neglected the contribution of less massive stars.
To calculate the radiation density at each point, we need to place the stars inside our 3D model. However, since NGC 3603 is far away, the exact distances of the stars are poorly constrained (Drew et al. 2019). We took the position of the stars in the sky and calculated their projected distance to the centre of the star cluster. With the standard deviation of this quantity, which is 21 pc, we generated a Gaussian distribution centred at 7 kpc. We used this distribution to randomly set the distance of every single star. We then assumed that the stars emit as a black body and the contribution of every single star decreases as the distance squared. In addition, we also include the cosmic microwave background (CMB) radiation and a dust component.
To estimate the systematic uncertainty of this parameter, we distributed the stars and calculated their resulting radiation field 100 times. An instance of this star distribution process is shown in the upper panel of Figure 1. The resulting radiation density spectrum is shown in the lower panel, where the blue line shows the mean stellar radiation field and the blue shaded band shows its 1σ uncertainty. The data points show the radiation inside the star-forming region estimated from infrared, optical, and ultraviolet data (De Buizer et al. 2024; Sher 1965), while applying the corresponding extinction correction factor for each band (4.72± 0.10 magnitudes in the V band, 6.05 ±0.10 in B, and 7.35± 0.12 in U Pang et al. 2016). We also address the possible systematic uncertainties here by using the results of Rogers et al. (2024), whose extinction factor in the V band is 3.1 ± 1.5. However, this result is set by observations in infrared and is more uncertain. There is a difference of around three to four orders of magnitude between our model and typical galactic interstellar radiation field (ISRF) models (e.g. Porter & Strong 2005) in that region. This difference might be due to the axial symmetry of the ISRF models, which averages over the azimuth angle of the Galaxy.
2.2 Gas density
The main gas density component in the region is the molecular gas. We followed Schneider et al. (2015) and performed a greybody fit to Herschel data in order to calculate the H2 column density. The results of our fit are shown in Figure 2. Although they are a bit noisier, they are similar to those reported in the original work. This noise will be averaged out when implemented into PICARD due to the spatial resolution of the simulation.
The column density is the integrated gas density along the line of sight in the region. To determine its 3D distribution, we assumed that the clouds have constant density and their centroids are located at the same distance as the star-forming region. The clouds that are introduced in the simulation box are marked with white circles and ellipses in Figure 2. There are four small dense clouds and a bigger elliptical one in order to account for the leftovers. Their densities and radii are shown in Table 1.
It is not clear whether the molecular cloud located at RA 169.4°, Dec –61.35° belongs to NGC 3603. It could be related to the star-forming region NGC 3756, which is located to the west of our studied region, but located at a distance of 2.8 kpc (de Pree et al. 1999). We used the MOPRA survey of CO velocity maps (Cubuk et al. 2023) to verify this estimate. While the molecular clouds belonging to NGC 3603 are found between 8 and 22 km/s (Röllig et al. 2011), the outer cloud is in the range of –30 to –16 km/s. Thus, this cloud appears to be not linked to NGC 3603 and it is therefore not included in our simulation.
For atomic hydrogen, no detailed data are available. Hence, we used the resulting constant density and cloud size from Retallack & Goss (1980), based on observations at 1415 MHz (21 cm). These are two clouds, which are shown as blue circles in Figure 2. Their physical characteristics are also described in Table 1. Finally, there are two main clumps of ionized hydrogen, as seen in Nürnberger (2003), shown as red circles in our figure. In this case, we used the electron population from McLeod et al. (2016), based on optical Multi-Unit Spectroscopic Explorer (MUSE) data. In addition, we take helium into account in all our target gas components, with a helium-to-hydrogen ratio of 0.11.
Properties of the clouds included in the simulation.
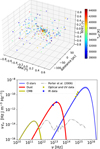 |
Fig. 1 3D distribution of O stars in our model (top) and radiation field density at the centre of the simulation box (bottom). Colours in the top panel represent the effective temperature of the stars. The yellow data points in the lower panel are from Sher (1965), blue stars show the data from De Buizer et al. (2024). The blue shaded band shows the uncertainty in the stars’ radiation component, while the gray dash-dotted line shows the Galactic ISRF model from Porter & Strong (2005). |
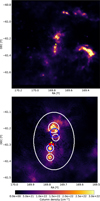 |
Fig. 2 Molecular gas column density in the NGC 3603 region (top) and zoomed central region (bottom). The yellow star marks the position of the stellar cluster. The size of the upper map represents the size of the simulation box. White circles and ellipses show the molecular clouds introduced in our simulation box, blue circles show the position of the atomic clouds, and filled red circles show the ionized gas. |
2.3 Particle injection and propagation
To understand the origin of the gamma-ray emission, we considered three different scenarios for the particle injection: a purely leptonic case, where we inject only electrons; a purely hadronic scenario, where we inject only protons; and, finally, a hybrid setup, where both electrons and protons are injected. Additionally, secondary CR electrons and positrons will also be produced in the scenarios containing CR protons through pp-interactions.
We assumed the acceleration mechanism in the system to be DSA at the termination shock. We did not implement the build-up of the spectrum of accelerated particles by the DSA mechanism; rather, we simply injected the readily accelerated particles at the shock position. To locate the termination shock, we used a spherical shell with half of the bubble’s radius. The bubble evolution equations (Weaver et al. 1977), in the case of NGC 3603, predict a radius of
 (2)
(2)
with next = 10 cm−3 and LW ≈3.2 · 1038 erg/s (Drissen et al. 1995). This kinetic wind luminosity value is calculated summing the mass outflows of the most massive stars within NGC 3603 and is dominated by three WR systems, whose contribution represents around 60% of the total stellar wind power (Crowther & Dessart 1998). Observations, however, have revealed a value of Rb ∼1 pc (Balick et al. 1980), which is much smaller than the theoretical prediction. This might be due to the high-density clouds surrounding the star-forming region or because the stars were not born at the same time. In this study, we proceed with the observational value, which leads to a radius for the termination shock of Rts = Rb/2 ≈ 0.5 pc.
For the energy dependence of the particle injection, we used a single power law with an exponential cutoff of
 (3)
(3)
where Q0 is given by demanding that the injected energy is a fraction of the wind kinetic luminosity
 (4)
(4)
where η is the efficiency of the acceleration.
After being injected, the particles propagate and suffer further energy gains, through second order Fermi acceleration (Thornbury & Drury 2014), and losses. The following energyloss processes are included in Eq. (1): pion production, Coulomb scattering, ionization, bremsstrahlung, synchrotron radiation, and inverse Compton (IC) scattering. The maximum energy achievable by electrons is determined by balancing the sum of all loss rates with the acceleration rate  . This results in an electron cutoff energy of Ec,e = 10 TeV. On the other hand, the energy losses are negligible for protons and the corresponding spectral cutoff energy is given by the size of the acceleration region through Ec,p ∼ eBVwRs = 50 TeV (Morlino et al. 2021).
The winds in star clusters can naturally develop Kolmogorov turbulence (Gallegos-Garcia et al. 2020). Assuming this regime for the magnetic field turbulence inside the shocked region, the spatial diffusion coefficient can be estimated as (Morlino et al. 2021)
 (5)
(5)
with rL the Larmor radius of the particles, Lc the size of the cluster, and Rs the radius of the shock. We used this estimation as our fiducial value and evaluated the systematic uncertainties with a diffusion normalization of ∼ 2.0·1026 cm2/s (following Eq. (22) in Parizot et al. 2004). Outside the star-forming region bubble, we used D0 = 2.0 · 1028 cm2 s−1 as the normalization at 1 GeV to reproduce the interstellar Galactic propagation, but keeping the same scaling with energy. This value is an estimate based on the allowed range of local cosmic-ray measurements (e.g. Evoli et al. 2019; Thaler et al. 2023, for opposite extremes of this range).
The region contains a large number of O- and Wolf-Rayet stars, which have wind velocities between 2000 and 3000 km/s (Prinja et al. 1990). Thus, we assumed a radial collective wind with a velocity of vW = 2500 km/s.
MHD simulations have shown that the magnetic field inside star-forming regions varies much depending on the exact position, with drastic changes on scales of ∼0.05 pc and with magnetic field values ranging from a few to hundreds of µG (Badmaev et al. 2022). To model such a turbulent magnetic field is beyond the scope of this work. Instead, we have considered a constant value of 7 µG for the whole shocked region. This value is an average over the resulting magnetic field from a MHD simulation of the innermost region of a star cluster (Badmaev et al. 2022; Bykov et al. 2023).
3 Gamma-ray observations
To observationally constrain the non-thermal output of our model, we performed a morphological and spectroscopic analysis of NGC 3603 in the GeV photon band. The LAT is a pair-production γ-ray detector, part of the Fermi Gamma-ray Space Telescope mission (Atwood et al. 2009). In operation since August 2008, it performs an all-sky survey in the γ-ray band from 30 MeV to more than 500 GeV. Its point-spread function (PSF) is energy-dependent. It varies from several degrees at the lowest energies to less than 0.1° at 10 GeV (Abdollahi et al. 2020). Those values refer to average quality-reconstruction data; hence we chose to perform an optimized analysis through different cut selections.
In this work, we perform a binned maximum-likelihood analysis fit (Mattox et al. 1996) on more than 15 years of LAT data (August 4 2008 to January 18 2024). We selected P8R3 SOURCE data (evclass = 128; Atwood et al. 2013; Bruel et al. 2018) between 1 GeV to 1 TeV, with a cut on the zenith angle zmax at 105°. With NGC 3603 being an established bright source at those energies (4FGL J1115.1-6118; Saha et al. 2020), we can apply a cut on the direction reconstruction quality, using only the best-quality data quartile (PSF3, evtype = 32).
The data were binned in a 10° × 10° grid with 0.05° spatial bins and eight energy bins per decade, while the analysis itself is performed using the Fermitools (v2.2.0; Fermi Science Support Development Team 2019) and fermipy (v1.2.0; Wood et al. 2017). As a source background model, we employed the 4FGL-DR4 catalogue (v33; Abdollahi et al. 2020; Ballet et al. 2023), with ‘gll_iem_v07.fits’ and ‘iso_P8R3_SOURCE_V3_PSF3_v1.txt’ as the Galactic and isotropic diffuse components, respectively. The energy dispersion correction is applied to all sources, apart from the isotropic diffuse component. In this set-up, the detection significance is evaluated considering the test statistic TS = −2 ln Lmax,0/Lmax,1, where Lmax,0 is the likelihood value for the null hypothesis and Lmax,1 the likelihood for the tested model. A TS = 25 roughly corresponds to a detection at 5σ and 4σ, for one and four source parameters, respectively.
Our analysis was performed in three steps: (1) we optimized the region of interest (ROI) through an iterative process, fitting the normalization of all sources in descending order of their predicted number of counts (Npred) down to Npred = 1 (fermipy.optimize). Then, (2) we freed the normalization of all sources within 6° of the ROI centre, and fit them with NEWMINUIT. Finally, (3) we searched for new sources (>4σ, >0.3° from known sources), re-localized the nearby extended source 4FGL J1109.4-6115e (r = 1.27°, at 0.69° from NGC 3603), and repeated step 2, but freeing all spectral parameters for those sources previously detected above 5σ. These steps result in a good data-model agreement as seen in the p-value statistic (PS; Bruel 2021) residuals of our ROI (Appendix A), and the addition of seven putative sources, all far away from NGC 3603 (> 3.4°; Appendix B). The centroid of 4FGL J1109.4-6115e was displaced to (l, b) = (290.634 ± 0.082, −0.773 ±0.067), with an offset of 0.35° with respect to its catalogue position and 1.0° from NGC 3603. Furthermore, 4FGL J1115.1-6118 was detected with TS = 163.5, Γ = 2.54 ± 0.13, an integrated photon flux above 1 GeV of (1.94 ± 0.22) × 10−9 photons cm−2 s−1.
The previous description provides an optimal ROI background at the energies where LAT performs best, yet it is insufficient when attempting to achieve either the spectral or morphological objectives of the present analysis; namely, to provide the required information to identify the parent particle population and resolve the source extension below 0.1°. To this end we employed two additional analyses: setting the low energy thresholds at 100 MeV and 10 GeV, respectively. While the latter can make use of the same set-up, the former requires an update of the ROI to 20° × 20° (with spatial bins of 0.1°) and a reduced maximum zenith angle of 90° to avoid Earth-limb contamination. In both cases, we employed the resulting model from the 1 GeV threshold analysis as our initial background and then performed steps 1 and 2, then we searched for new sources, while setting the spectral parameters of 4FGL J1115.1-6118 free (see Figure 3 and Table 2). Again, we validated the fit through the distribution of PS residuals.
The latter analysis set-up, namely, at values energies above 10 GeV (TS = 28.3), provides an upper limit of 0.096° for the extension of 4FGL J1115.1-6118 at a 95% confidence level (TSext = 2.3). This result could be highly dependent on the underlying diffuse model (Saha et al. 2020); therefore, we tested for the extension also employing an older version of it (‘gll_iem_v06.fits’). We find the lack of extension to be robust under the PSF3 selection (TSext = 0.6), with the 95% upper limit set at 0.084°. We note, however, that the detection is less significant, as the TS of 4FGL J1115.1-6118 goes down to 19.3.
In addition, it is relevant to assess the possible presence of a distinct component in the same energy range, already discussed in Saha et al. (2020), as well as its spectral shape. Therefore we repeat the analysis above this energy threshold, but now without the constraint on the quality reconstruction (i.e. a joint analysis using event types 4, 8, 16, and 32; PSF0–3). This increases the number of events by about four times, which allows for a better assessment of the spectral characteristics, with a source detection at ∼10σ. Despite the larger PSF, the increased statistics facilitate as well a better localization (∼ 50% improvement) of the centroid of the gamma-ray source (l,b) = (291.624 ±0.012, −0.553 ± 0.013). That is consistent with the 4FGL-DR4 localization and the centre of NGC 3603. Such a selection leads to a worse extension constraint due to a higher preference for extension (TSext = 11.1, 95% upper limit at 0.106°). Finally, we tested the presence of curvature assuming a power law and log parabola, finding no preference for the curvature (ΔTS = 2.2), but noting it is aptly represented by a hard spectrum (Γ = 2.0 ± 0.1), which does not differ by more than 4σ from that of a single power law above 1 GeV.
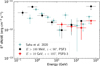 |
Fig. 3 Resulting SED for the datasets above 100 MeV and 10 GeV, respectively, and compared with the results from Saha et al. (2020). Upper limits on Fermi-LAT at the 95% confidence level are reported for energy bins detected at less than 2σ. |
Fermi-LAT analysis results for NGC 3603.
4 Results
We used mainly the gamma-ray spectrum to constrain the free parameters in our model. We test the injection spectral index α in a range α ∈[2.2, 2.8] in steps of 0.05, performing a chisquare fit of the gamma-ray spectrum to find the best acceleration efficiency for every single slope. The final model is the one with the slope resulting in the best chi-square result after the efficiency fitting. To calculate the gamma-ray fluxes, we took into account pion production, initiated by CR protons, as well as IC scattering and non-thermal bremsstrahlung, by CR leptons. We used the cross-sections from Kamae et al. (2006), included in PICARD, to compute the proton-proton interactions in the former process. We estimated systematic uncertainties by alternatively employing the cross-sections from Orusa et al. (2023).
In addition, we also considered the effect of γγ-pair production on the resulting gamma-ray emission. Despite the high number of UV photons in comparison to the typical ISRF models in the Galaxy (see Figure 1), the size of the star-forming region is too small for the absorption to make an important contribution given the γγ-cross-section. The flux decreased by only ∼0.8% at the energy of the maximum effect (∼100 GeV).
4.1 Hadronic scenario
We show the resulting cosmic-ray spectra of the hadronic scenario in the upper panel of Figure 4 and their associated spectral energy distribution in the lower one. In this case, the best-fit scenario results in an injection index of αhad = 2.6 ± 0.1. However, this result faces the problem of an unusually high acceleration efficiency of 26% ±5%, in contrast to the typical assumption of 10% efficiency.
The systematic uncertainties stated above reflect the impact of our parameter and cross-section choice. If we use the diffusion coefficient from Parizot et al. (2004) (lower than our fiducial value), the cosmic-ray content of the source increases, reducing the acceleration efficiency necessary by 5%. The choice of cross-sections, on the other hand, affects lightly the particle injection index necessary to reproduce the measured gamma-ray spectrum.
In order to compare the γ-ray extension of our model with the observational result, we need to account for the LAT PSF. Therefore, we smooth our resulting γ-ray maps using a Gaussian kernel with the PSF of the instrument (Ajello et al. 2021). The resulting emission map is shown in Figure 5. The extension of the γ-ray emission originating from our model is calculated as the 1σ containment radius, to be comparable with the data analysis. It gives an extension of 0.098° for energies above 10 GeV. This result is in mild tension with the data upper limit, especially considering our limited knowledge on the Galactic diffuse model. Our predicted γ-ray extension is shown in Table 3.
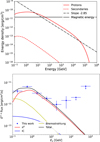 |
Fig. 4 Cosmic-ray (top) and gamma-ray (bottom) spectrum in the hadronic scenario. Secondaries are electrons and positrons created by CR protons in pp-interactions. The gray band shows the H.E.S.S. sensitivity for 50 h of observations (Holler et al. 2015). |
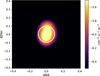 |
Fig. 5 Resulting integrated gamma-ray map above 10 GeV in the hadronic scenario. The white circle shows the extension upper limit from Fermi-LAT at 95% confidence level. |
Extension of the γ-ray source in the data and the different scenarios above 10 GeV.
4.2 Leptonic scenario
The results of this scenario are shown in Figure 6. In this case, the best-fit injection particle spectral index is αlep = 2.5 ± 0.1, while the acceleration efficiency is found to be around 0.4% ± 0.1% – much less energy is needed to reach the measured flux. The uncertainty here is mainly coming from the systematic uncertainty in the radiation field procedure described in Section 2.1. If we use the alternative extinction factor (Rogers et al. 2024), the necessary efficiency would rise to 1.6% ± 0.2%. As we can see in the lower panel of Figure 6, the model does not reproduce the observed gamma-ray spectrum well. The data present a bump-like feature at low energies, which is completely missed in this scenario. In this case, however, the resulting extension is 0.086°, which is consistent with the upper limit extracted from the data.
4.3 Hybrid scenario
The fitting results in the hybrid scenario can be seen in Figure 7. The best-fit result to the gamma-ray spectrum leads to an injection of protons with an index αhyb,p = 2.55, electrons with αhyb,e = 2.65, with an acceleration efficiency around 20% and a np/ne injected ratio of 200. In this case, the gamma-ray spectrum is still well reproduced, and the extension of the emission is 0.096°. On the other hand, if we slightly alter the parameter values, the extension can be lowered with still a decent fit to the gamma-ray spectrum. For example, when using αhyb,p = 2.5, αhyb,e = 2.65, the efficiency needed is reduced to about 10% and the np/ne ratio gives 80. The resulting gamma-ray spectrum is shown as the dash-dotted line in the lower panel of Figure 7 and the extension is 0.093°, consistent with the data.
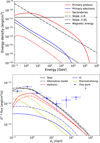 |
Fig. 7 Same as Figure 4 but for the hybrid scenario. The dashed lines in the gamma-ray spectrum show an alternative option to the best-fitting result. |
4.4 Other wavelengths and observables
To further constrain the contributions of each particle population to the total gamma-ray emission, we also considered other wavelengths and observables, such as radio and X-ray radiation and neutrino emission. NGC 3603 was already studied in the radio domain by Mücke et al. (2002) with the Australia Telescope Compact Array (ATCA) to search for possible non-thermal signals. However, their results were inconclusive, neither a cosmic-ray nor a thermal component from cold dust could explain the measured data alone.
In contrast to the data, which resembles a quasi-point-like source (∼ 1 arcsec) at the centre of the star cluster, the results of our simulations are much more extended (∼ 30 arcsec). With this incompatibility in size, our models would need to be below the sensitivity of the observations in order to be acceptable. We show the synchrotron surface brightness in Figure 8, together with the measured data and the sensitivity of the instrument, given by the r.m.s of the noise of the observations. The results clearly disfavour a leptonic-only scenario, whose synchrotron emission is above the sensitivity of the ATCA observations. The hybrid and hadronic scenarios are compatible with the radio data, since they are both below the sensitivity. As already suggested in Nürnberger (2003), the data appear to be better reproduced with a thermal origin. This hypothesis is also shown in the figure with a model for the thermal bremsstrahlung from a population of electrons with temperature 104 K. If we considered X-ray wave-lengths instead, our resulting electron population would produce a non-thermal flux that is four orders of magnitude below the diffuse thermal component measured by Chandra in the 0.5–7 keV energy range (Townsley et al. 2011).
High-energy neutrinos are produced in cosmic-ray proton interactions, therefore they represent a good tracer of the hadronic origin of gamma rays. We calculate the neutrino production for our scenarios containing relativistic protons using the Kamae cross-sections (Kamae et al. 2006). Our results are shown in Figure 9. All are far below the sensitivity of the Ice-Cube experiment (Aartsen et al. 2017) for this sky region, whose declination is δ ∼ −60°. Other instruments, such as ANTARES or KM3Net are also unlikely to detect it. This is mainly because of the low energy of the neutrinos, whose peak is at ∼1 GeV, while the instruments are optimized for higher energies.
 |
Fig. 8 Radio flux from NGC 3603. The black solid line shows a thermal bremsstrahlung emission coming from an electron population with 104 K and black dots are the measured data from Mücke et al. (2002). The star markers represent the sensitivity limit of the ATCA observations. |
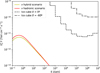 |
Fig. 9 Neutrino flux from NGC 3603. The black dashed and dashdotted lines represent the IceCube experiment sensitivity for different declinations (Aartsen et al. 2017). |
5 Discussion
This approach to modelling the extension is very robust. The resulting injection indexes and particle acceleration efficiencies have relatively small uncertainties due to the different models or parameters that one can use. Notably, we find no impact on the gamma-ray extension. Due to the small size of the region, even when reducing the diffusion coefficient by a factor of 2, cosmic-ray protons are able to reach the outer molecular clouds, where the gamma rays are produced. Therefore, the results are mainly determined by the angular size of the gas in the observations. In the case of IC by electrons, the uncertainty in the stellar distances also have a minimal effect on the spatial extension of the gamma-ray source. This is probably a result of the precise 2D position determination captured via optical observations. In contrast to protons, electrons only propagate a limited distance, which will appear larger if the source is closer. Hence, the resulting leptonic extension is more subject to the uncertainty in the star-forming region distance. Recent measurements of the NGC 3603 distance result in 7.2 ± 0.1 kpc (Drew et al. 2019), which already makes our calculations conservative.
On one hand, the dense molecular clouds surrounding NGC 3603 may serve as target material for the production of gamma rays. Hence, in the hadronic scenario, the more surrounding material, the higher the produced gamma-ray flux. This scenario can provide a good fit of the spectrum, but the extension of the simulations is in tension with the data upper limits. It can be solved introducing some amount of primary electrons. In the alternative hybrid scenario we presented, 45% of the total gamma-ray energy has a primary leptonic origin, decreasing the extension to 0.093° for energies above 10 GeV. For a more in-depth comparison, we introduced the simulated map and spectrum for each scenario in our gamma-ray likelihood analysis above 10 GeV. We compared the results with those of a point-like source with Γ = 2.54 (i.e. the photon index above 1 GeV). The background remains fixed and therefore the normalization is the only degree of freedom in each scenario. We found the point-like source to be preferred. However, the overall morphological preference for a point-like source is solely at the level of ΔTS = 3–5 (Table 3).
On the other hand, the dense clouds make it more difficult for the bubble (and the shock) to form and grow. The necessary efficiency in the hadronic scenario is rather high compared to the standard 10% value. However, there are studies indicating that star-forming regions could reach efficiencies of 30% in the early stages of the bubble (Bykov 1999). This might be the case for NGC 3603, with an age of only 1–2 Myr (Melena et al. 2008). The index of the measured gamma-ray spectrum (Γ = 2.54) might be a consequence of this young age and the dense surrounding molecular clouds. The shock might not be completely formed, leading to softer indices compared to older star-forming regions (e.g. Westerlund 1; Aharonian et al. 2022) or SNRs.
Considering alternative source scenarios for the gamma-ray origin, this system is too young to contain supernova remnants or pulsar wind nebulae. Furthermore, the closest source in the ATNF catalogue1 (Manchester et al. 2005) is PSR J1114-6100, which has no association listed in the catalogue. Nevertheless, it is located at a distance of ∼0.28°, outside the detected gamma-ray source. The only other possible scenario, thus far disregarded, would be that of a single star or stellar binary being primarily responsible for the radio and gamma-ray emission from this region. The three WR systems hosted by NGC 3603 are responsible for most of the cluster’s wind kinetic power (Crowther & Dessart 1998). It is most likely that some of them are in colliding-wind binary systems (Moffat et al. 2002), as is the case at least for NGC 3603–A1 (WR 43a) and NGC 3603– C (WR 43c) have known orbital periods (3.77 and 8.89 days, respectively; Schnurr et al. 2008). A priori, the most suitable candidate appears to be NGC 3603–A1, coincident with the radio emission at the core of the stellar cluster (Moffat et al. 2002) and within the 95% localization of 4FGL J1115.1-6118’s centroid. This is a particularly massive system (total mass likely higher than 200 M⊙), with a wind kinetic power of ∼1.5 × 1038 erg/s, and very similar to the well-studied WR 20a. The appeal of this scenario is fostered by the previous detection of two CWBs by Fermi-LAT (η Car and γ2 Vel; Abdo et al. 2010; Martí-Devesa et al. 2020); both without strong radio synchrotron emission. Furthermore, η Car has an additional hard spectrum beyond 10 GeV (Bednarek & Pabich 2011). If 4FGL J1115.1-6118 turned out to be a CWB instead, this scenario would be consistent with the point-like nature of the gamma-ray signal and the observed photon index. However, employing photon weights (Kerr 2019) we do not find a significant periodical modulation in a blind search, nor phase-folding the gamma-ray data with the orbital periods of NGC 3603–A1 or NGC 3603–C. Dedicated simulations of the binary system are necessary to further explore this hypothesis.
6 Conclusions
With the long-standing challenges to the SNR scenario with respect to explaining all the observable cosmic-ray data, starforming regions have recently gained a lot of interest as cosmicray sources. We studied the case of NGC 3603, a young and compact star-forming region that is ideally suited to the acceleration of high-energy particles. We performed a CR injection and propagation to investigate the origin of the gamma-ray emission (Yang, Rui-zhi & Aharonian, Felix 2017; Saha et al. 2020). To do so, we built a realistic 3D model of its radiation field and gas distributions to have a robust result of the extension of the gamma-ray source.
Some works have already shown the difficulties for starforming regions to be PeVatron sources (Morlino et al. 2021; Vieu et al. 2022b) due to their small size. In the case of NGC 3603, even though it is considered a very powerful star cluster, with LW ≈ 3.2 · 1038 erg s−1, its young age and the dense molecular clouds surrounding it have likely prevented the bubble from growing larger. Considering also its distance, NGC 3603 will be complicated to detect by TeV facilities such as H.E.S.S. assuming a cluster origin for the gamma-ray signal (as seen in e.g. Figure 4).
Coming back to the main question of this work, the pure hadronic scenario presents a light tension with the data upper limit on the extension of the gamma-ray source. Although this tension is mild considering the analysis uncertainties, it can be avoided by introducing primary electrons. Primary electrons on their own also face difficulties when we are attempting to explain multi-wavelength data due to conflicts with the radio observations. Therefore, the NGC 3603 high-energy emissions more likely originate from a mixture of cosmic-ray electrons and protons. The source extension is a robust observable that is helpful for discerning the underlying particle population producing the measured gamma rays. The measurement of this extension by mission concepts that employ techniques to gain resolving power in the (sub-)GeV band, such as GRAINE (Nakamura et al. 2025) or HARPO (Gros et al. 2018), might help in determining each contribution precisely. Other proposed missions such as AMEGO-X (Caputo et al. 2022) or e-ASTROGAM (de Angelis et al. 2018) would cover the MeV range, where the various emission models are expected to show distinct spectral features. On the basis of current instrumental capabilities, both cosmic-ray protons and electrons must be of similar importance in the emitted gamma-ray energy to accommodate the upper limit on the source extension.
Acknowledgements
The authors want to thank Luigi Tibaldo for the fruitful discussions and thoughtful comments that helped improving this paper. The Fermi LAT Collaboration acknowledges generous ongoing support from a number of agencies and institutes that have supported both the development and the operation of the LAT as well as scientific data analysis. These include the National Aeronautics and Space Administration and the Department of Energy in the United States, the Commissariat à l’Energie Atomique and the Centre National de la Recherche Scientifique / Institut National de Physique Nucléaire et de Physique des Particules in France, the Agenzia Spaziale Italiana and the Istituto Nazionale di Fisica Nucleare in Italy, the Ministry of Education, Culture, Sports, Science and Technology (MEXT), High Energy Accelerator Research Organization (KEK) and Japan Aerospace Exploration Agency (JAXA) in Japan, and the K.A. Wallenberg Foundation, the Swedish Research Council and the Swedish National Space Board in Sweden. Additional support for science analysis during the operations phase from the following agencies is also gratefully acknowledged: the Istituto Nazionale di Astrofisica in Italy and the Centre National d’Etudes Spatiales in France. This work performed in part under DOE Contract DE-AC02-76SF00515.
Appendix A Data-model validation of the region of interest
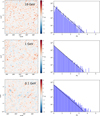 |
Fig. A.1 Left: P-value statistic (PS) residual map of the ROI, following the data-model comparison method developed by Bruel (2021). Each map is saturated at PS = 4.2, corresponding to 4σ for point-like sources. Right: PS distribution of each map. The top, middle, and bottom panels correspond to the analyses above 10 GeV, 1 GeV and 100 MeV, respectively. If all sources are accounted for in the model, the PS histogram should follow a distribution ∝ 10−x (black line). |
Appendix B Additional excess with respect to 4FGL-DR4
Point-like Fermi-LAT excesses found in the analysis above 1 GeV. Those excesses could be either new sources or diffuse emission not accounted for in our Galactic diffuse model.
References
- Aartsen, M. G., Abraham, K., Ackermann, M., et al. 2017, ApJ, 835, 151 [Google Scholar]
- Abdo, A. A., Ackermann, M., Ajello, M., et al. 2010, ApJ, 723, 649 [NASA ADS] [CrossRef] [Google Scholar]
- Abdollahi, S., Acero, F., Ackermann, M., et al. 2020, ApJS, 247, 33 [Google Scholar]
- Abeysekara, A. U., Albert, A., Alfaro, R., et al. 2021, Nat. Astron., 5, 465 [NASA ADS] [CrossRef] [Google Scholar]
- Abramowski, A., Acero, F., Aharonian, F., et al. 2012, A&A, 537, A114 [NASA ADS] [CrossRef] [EDP Sciences] [Google Scholar]
- Ackermann, M., Ajello, M., Allafort, A., et al. 2011, Science, 334, 1103 [NASA ADS] [CrossRef] [Google Scholar]
- Aharonian, F., Yang, R., & de Oña Wilhelmi, E. 2019, Nat. Astron., 3, 561 [Google Scholar]
- Aharonian, F., Ashkar, H., Backes, M., et al. 2022, A&A, 666, A124 [NASA ADS] [CrossRef] [EDP Sciences] [Google Scholar]
- Ajello, M., Atwood, W. B., Axelsson, M., et al. 2021, ApJS, 256, 12 [NASA ADS] [CrossRef] [Google Scholar]
- Atwood, W. B., Abdo, A. A., Ackermann, M., et al. 2009, ApJ, 697, 1071 [CrossRef] [Google Scholar]
- Atwood, W., Albert, A., Baldini, L., et al. 2013, arXiv e-prints [arXiv:1303.3514] [Google Scholar]
- Badmaev, D. V., Bykov, A. M., & Kalyashova, M. E. 2022, MNRAS, 517, 2818 [NASA ADS] [CrossRef] [Google Scholar]
- Balick, B., Boeshaar, G. O., & Gull, T. R. 1980, ApJ, 242, 584 [Google Scholar]
- Ballet, J., Bruel, P., Burnett, T. H., Lott, B., & The Fermi-LAT collaboration. 2023, arXiv e-prints [arXiv:2307.12546] [Google Scholar]
- Bednarek, W., & Pabich, J. 2011, A&A, 530, A49 [NASA ADS] [CrossRef] [EDP Sciences] [Google Scholar]
- Bell, A. R. 2004, MNRAS, 353, 550 [Google Scholar]
- Berezinskii, V. S., Bulanov, S. V., Dogiel, V. A., & Ptuskin, V. S. 1990, Astrophysics of cosmic rays [Google Scholar]
- Binns, W. R., Wiedenbeck, M. E., Arnould, M., et al. 2008, New A Rev., 52, 427 [NASA ADS] [CrossRef] [Google Scholar]
- Bruel, P. 2021, A&A, 656, A81 [NASA ADS] [CrossRef] [EDP Sciences] [Google Scholar]
- Bruel, P., Burnett, T. H., Digel, S. W., et al. 2018, arXiv e-prints [arXiv:1810.11394] [Google Scholar]
- Bykov, A. M. 1999, in Astronomical Society of the Pacific Conference Series, 171, LiBeB Cosmic Rays, and Related X- and Gamma-Rays, eds. R. Ramaty, E. Vangioni-Flam, M. Cassé, & K. Olive, 146 [Google Scholar]
- Bykov, A. M. 2014, A&A Rev., 22, 77 [Google Scholar]
- Bykov, A. M., & Kalyashova, M. E. 2022, Adv. Space Res., 70, 2685 [Google Scholar]
- Bykov, A. M., Marcowith, A., Amato, E., et al. 2020, Space Sci. Rev., 216, 42 [CrossRef] [Google Scholar]
- Bykov, A. M., Uvarov, Y. A., Kalyashova, M. E., et al. 2023, MNRAS, 525, 1553 [Google Scholar]
- Caputo, R., Ajello, M., Kierans, C. A., et al. 2022, J. Astron. Telesc. Instrum. Syst., 8, 044003 [NASA ADS] [CrossRef] [Google Scholar]
- Cesarsky, C. J., & Montmerle, T. 1983, Space Sci. Rev., 36, 173 [NASA ADS] [CrossRef] [Google Scholar]
- Cristofari, P., Blasi, P., & Amato, E. 2020, Astropart. Phys., 123, 102492 [Google Scholar]
- Crowther, P. A., & Dessart, L. 1998, MNRAS, 296, 622 [NASA ADS] [CrossRef] [Google Scholar]
- Cubuk, K. O., Burton, M. G., Braiding, C., et al. 2023, PASA, 40, e047 [NASA ADS] [CrossRef] [Google Scholar]
- de Angelis, A., Tatischeff, V., Grenier, I. A., et al. 2018, J. High Energy Astrophys., 19, 1 [NASA ADS] [CrossRef] [Google Scholar]
- De Buizer, J. M., Lim, W., Karnath, N., & Radomski, J. T. 2024, ApJ, 963, 55 [NASA ADS] [CrossRef] [Google Scholar]
- de Pree, C. G., Nysewander, M. C., & Goss, W. M. 1999, AJ, 117, 2902 [Google Scholar]
- Drew, J. E., Monguió, M., & Wright, N. J. 2019, MNRAS, 486, 1034 [NASA ADS] [CrossRef] [Google Scholar]
- Drissen, L., Moffat, A. F. J., Walborn, N. R., & Shara, M. M. 1995, AJ, 110, 2235 [Google Scholar]
- Evoli, C., Aloisio, R., & Blasi, P. 2019, Phys. Rev. D, 99, 103023 [CrossRef] [Google Scholar]
- Fermi Science Support Development Team 2019, Fermitools: Fermi Science Tools, Astrophysics Source Code Library [record ascl:1905.011] [Google Scholar]
- Gabici, S., Evoli, C., Gaggero, D., et al. 2019, Int. J. Mod. Phys. D, 28, 1930022 [CrossRef] [Google Scholar]
- Gallegos-Garcia, M., Burkhart, B., Rosen, A. L., Naiman, J. P., & Ramirez-Ruiz, E. 2020, ApJ, 899, L30 [CrossRef] [Google Scholar]
- Ginzburg, V. L., & Syrovatskii, S. I. 1964, The Origin of Cosmic Rays [Google Scholar]
- Gros, P., Amano, S., Attié, D., et al. 2018, Astropart. Phys., 97, 10 [Google Scholar]
- Gupta, S., Nath, B. B., Sharma, P., & Eichler, D. 2020, MNRAS, 493, 3159 [CrossRef] [Google Scholar]
- H.E.S.S. Collaboration (Abramowski, A., et al.) 2015, Science, 347, 406 [NASA ADS] [CrossRef] [Google Scholar]
- Härer, L. K., Reville, B., Hinton, J., Mohrmann, L., & Vieu, T. 2023, A&A, 671, A4 [NASA ADS] [CrossRef] [EDP Sciences] [Google Scholar]
- Higdon, J. C., & Lingenfelter, R. E. 2003, ApJ, 590, 822 [Google Scholar]
- Holler, M., Berge, D., van Eldik, C., et al. 2015, arXiv e-prints [arXiv:1509.02902] [Google Scholar]
- Kamae, T., Karlsson, N., Mizuno, T., Abe, T., & Koi, T. 2006, ApJ, 647, 692 [Google Scholar]
- Kerr, M. 2019, ApJ, 885, 92 [NASA ADS] [CrossRef] [Google Scholar]
- Kissmann, R. 2014, Astropart. Phys., 55, 37 [NASA ADS] [CrossRef] [Google Scholar]
- Lagage, P. O., & Cesarsky, C. J. 1983, A&A, 125, 249 [NASA ADS] [Google Scholar]
- Manchester, R. N., Hobbs, G. B., Teoh, A., & Hobbs, M. 2005, AJ, 129, 1993 [Google Scholar]
- Martí-Devesa, G., Reimer, O., Li, J., & Torres, D. F. 2020, A&A, 635, A141 [Google Scholar]
- Mattox, J. R., Bertsch, D. L., Chiang, J., et al. 1996, ApJ, 461, 396 [Google Scholar]
- Maurin, G., Marcowith, A., Komin, N., Krayzel, F., & Lamanna, G. 2016, A&A, 591, A71 [NASA ADS] [CrossRef] [EDP Sciences] [Google Scholar]
- McLeod, A. F., Gritschneder, M., Dale, J. E., et al. 2016, MNRAS, 462, 3537 [Google Scholar]
- Melena, N. W., Massey, P., Morrell, N. I., & Zangari, A. M. 2008, AJ, 135, 878 [NASA ADS] [CrossRef] [Google Scholar]
- Menchiari, S., Morlino, G., Amato, E., et al. 2025, A&A, 695, A175 [NASA ADS] [CrossRef] [EDP Sciences] [Google Scholar]
- Merloni, A., Lamer, G., Liu, T., et al. 2024, A&A, 682, A34 [NASA ADS] [CrossRef] [EDP Sciences] [Google Scholar]
- Moffat, A. F. J. 1983, A&A, 124, 273 [NASA ADS] [Google Scholar]
- Moffat, A. F. J., Drissen, L., & Shara, M. M. 1994, ApJ, 436, 183 [Google Scholar]
- Moffat, A. F. J., Corcoran, M. F., Stevens, I. R., et al. 2002, ApJ, 573, 191 [Google Scholar]
- Morlino, G., Blasi, P., Peretti, E., & Cristofari, P. 2021, MNRAS, 504, 6096 [NASA ADS] [CrossRef] [Google Scholar]
- Mücke, A., Koribalski, B. S., Moffat, A. F. J., Corcoran, M. F., & Stevens, I. R. 2002, ApJ, 571, 366 [CrossRef] [Google Scholar]
- Nakamura, Y., Aoki, S., Hayakawa, T., et al. 2025, Astropart. Phys., 165, 103055 [Google Scholar]
- Nürnberger, D. E. A. 2003, A&A, 404, 255 [NASA ADS] [CrossRef] [EDP Sciences] [Google Scholar]
- Orusa, L., Di Mauro, M., Donato, F., & Korsmeier, M. 2023, Phys. Rev. D, 107, 083031 [Google Scholar]
- Pang, X., Pasquali, A., & Grebel, E. K. 2016, AJ, 151, 23 [NASA ADS] [CrossRef] [Google Scholar]
- Parizot, E., Marcowith, A., van der Swaluw, E., Bykov, A. M., & Tatischeff, V. 2004, A&A, 424, 747 [NASA ADS] [CrossRef] [EDP Sciences] [Google Scholar]
- Porter, T. A., & Strong, A. W. 2005, in International Cosmic Ray Conference, 4, 29th International Cosmic Ray Conference (ICRC29), 77 [Google Scholar]
- Prinja, R. K., Barlow, M. J., & Howarth, I. D. 1990, ApJ, 361, 607 [NASA ADS] [CrossRef] [Google Scholar]
- Retallack, D. S., & Goss, W. M. 1980, MNRAS, 193, 261 [CrossRef] [Google Scholar]
- Rogers, C., Brandl, B., & De Marchi, G. 2024, A&A, 688, A111 [NASA ADS] [CrossRef] [EDP Sciences] [Google Scholar]
- Röllig, M., Kramer, C., Rajbahak, C., et al. 2011, A&A, 525, A8 [NASA ADS] [CrossRef] [EDP Sciences] [Google Scholar]
- Saha, L., Domínguez, A., Tibaldo, L., et al. 2020, ApJ, 897, 131 [NASA ADS] [CrossRef] [Google Scholar]
- Schneider, N., Ossenkopf, V., Csengeri, T., et al. 2015, A&A, 575, A79 [CrossRef] [EDP Sciences] [Google Scholar]
- Schnurr, O., Casoli, J., Chené, A. N., Moffat, A. F. J., & St-Louis, N. 2008, MNRAS, 389, L38 [NASA ADS] [CrossRef] [Google Scholar]
- Sher, D. 1965, MNRAS, 129, 237 [NASA ADS] [Google Scholar]
- Sung, H., & Bessell, M. S. 2004, AJ, 127, 1014 [NASA ADS] [CrossRef] [Google Scholar]
- Thaler, J., Kissmann, R., & Reimer, O. 2023, Astropart. Phys., 144, 102776 [Google Scholar]
- Thornbury, A., & Drury, L. O. 2014, MNRAS, 442, 3010 [NASA ADS] [CrossRef] [Google Scholar]
- Townsley, L. K., Broos, P. S., Chu, Y.-H., et al. 2011, ApJS, 194, 16 [NASA ADS] [CrossRef] [Google Scholar]
- Vieu, T., Gabici, S., Tatischeff, V., & Ravikularaman, S. 2022a, MNRAS, 512, 1275 [Google Scholar]
- Vieu, T., Reville, B., & Aharonian, F. 2022b, MNRAS, 515, 2256 [Google Scholar]
- Weaver, R., McCray, R., Castor, J., Shapiro, P., & Moore, R. 1977, ApJ, 218, 377 [Google Scholar]
- Wood, M., Caputo, R., Charles, E., et al. 2017, in International Cosmic Ray Conference, 301, 35th International Cosmic Ray Conference (ICRC2017), 824 [NASA ADS] [Google Scholar]
- Yang, R.-z., & Aharonian, F. 2017, A&A, 600, A107 [NASA ADS] [CrossRef] [EDP Sciences] [Google Scholar]
- Yang, R.-z., de Oña Wilhelmi, E., & Aharonian, F. 2018, A&A, 611, A77 [NASA ADS] [CrossRef] [EDP Sciences] [Google Scholar]
All Tables
Extension of the γ-ray source in the data and the different scenarios above 10 GeV.
Point-like Fermi-LAT excesses found in the analysis above 1 GeV. Those excesses could be either new sources or diffuse emission not accounted for in our Galactic diffuse model.
All Figures
|
Fig. 1 3D distribution of O stars in our model (top) and radiation field density at the centre of the simulation box (bottom). Colours in the top panel represent the effective temperature of the stars. The yellow data points in the lower panel are from Sher (1965), blue stars show the data from De Buizer et al. (2024). The blue shaded band shows the uncertainty in the stars’ radiation component, while the gray dash-dotted line shows the Galactic ISRF model from Porter & Strong (2005). |
| In the text | |
|
Fig. 2 Molecular gas column density in the NGC 3603 region (top) and zoomed central region (bottom). The yellow star marks the position of the stellar cluster. The size of the upper map represents the size of the simulation box. White circles and ellipses show the molecular clouds introduced in our simulation box, blue circles show the position of the atomic clouds, and filled red circles show the ionized gas. |
| In the text | |
|
Fig. 3 Resulting SED for the datasets above 100 MeV and 10 GeV, respectively, and compared with the results from Saha et al. (2020). Upper limits on Fermi-LAT at the 95% confidence level are reported for energy bins detected at less than 2σ. |
| In the text | |
|
Fig. 4 Cosmic-ray (top) and gamma-ray (bottom) spectrum in the hadronic scenario. Secondaries are electrons and positrons created by CR protons in pp-interactions. The gray band shows the H.E.S.S. sensitivity for 50 h of observations (Holler et al. 2015). |
| In the text | |
|
Fig. 5 Resulting integrated gamma-ray map above 10 GeV in the hadronic scenario. The white circle shows the extension upper limit from Fermi-LAT at 95% confidence level. |
| In the text | |
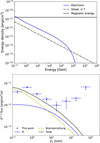 |
Fig. 6 Same as Figure 4, but for the leptonic case. |
| In the text | |
|
Fig. 7 Same as Figure 4 but for the hybrid scenario. The dashed lines in the gamma-ray spectrum show an alternative option to the best-fitting result. |
| In the text | |
|
Fig. 8 Radio flux from NGC 3603. The black solid line shows a thermal bremsstrahlung emission coming from an electron population with 104 K and black dots are the measured data from Mücke et al. (2002). The star markers represent the sensitivity limit of the ATCA observations. |
| In the text | |
|
Fig. 9 Neutrino flux from NGC 3603. The black dashed and dashdotted lines represent the IceCube experiment sensitivity for different declinations (Aartsen et al. 2017). |
| In the text | |
|
Fig. A.1 Left: P-value statistic (PS) residual map of the ROI, following the data-model comparison method developed by Bruel (2021). Each map is saturated at PS = 4.2, corresponding to 4σ for point-like sources. Right: PS distribution of each map. The top, middle, and bottom panels correspond to the analyses above 10 GeV, 1 GeV and 100 MeV, respectively. If all sources are accounted for in the model, the PS histogram should follow a distribution ∝ 10−x (black line). |
| In the text | |
Current usage metrics show cumulative count of Article Views (full-text article views including HTML views, PDF and ePub downloads, according to the available data) and Abstracts Views on Vision4Press platform.
Data correspond to usage on the plateform after 2015. The current usage metrics is available 48-96 hours after online publication and is updated daily on week days.
Initial download of the metrics may take a while.