Fig. 2
Download original image
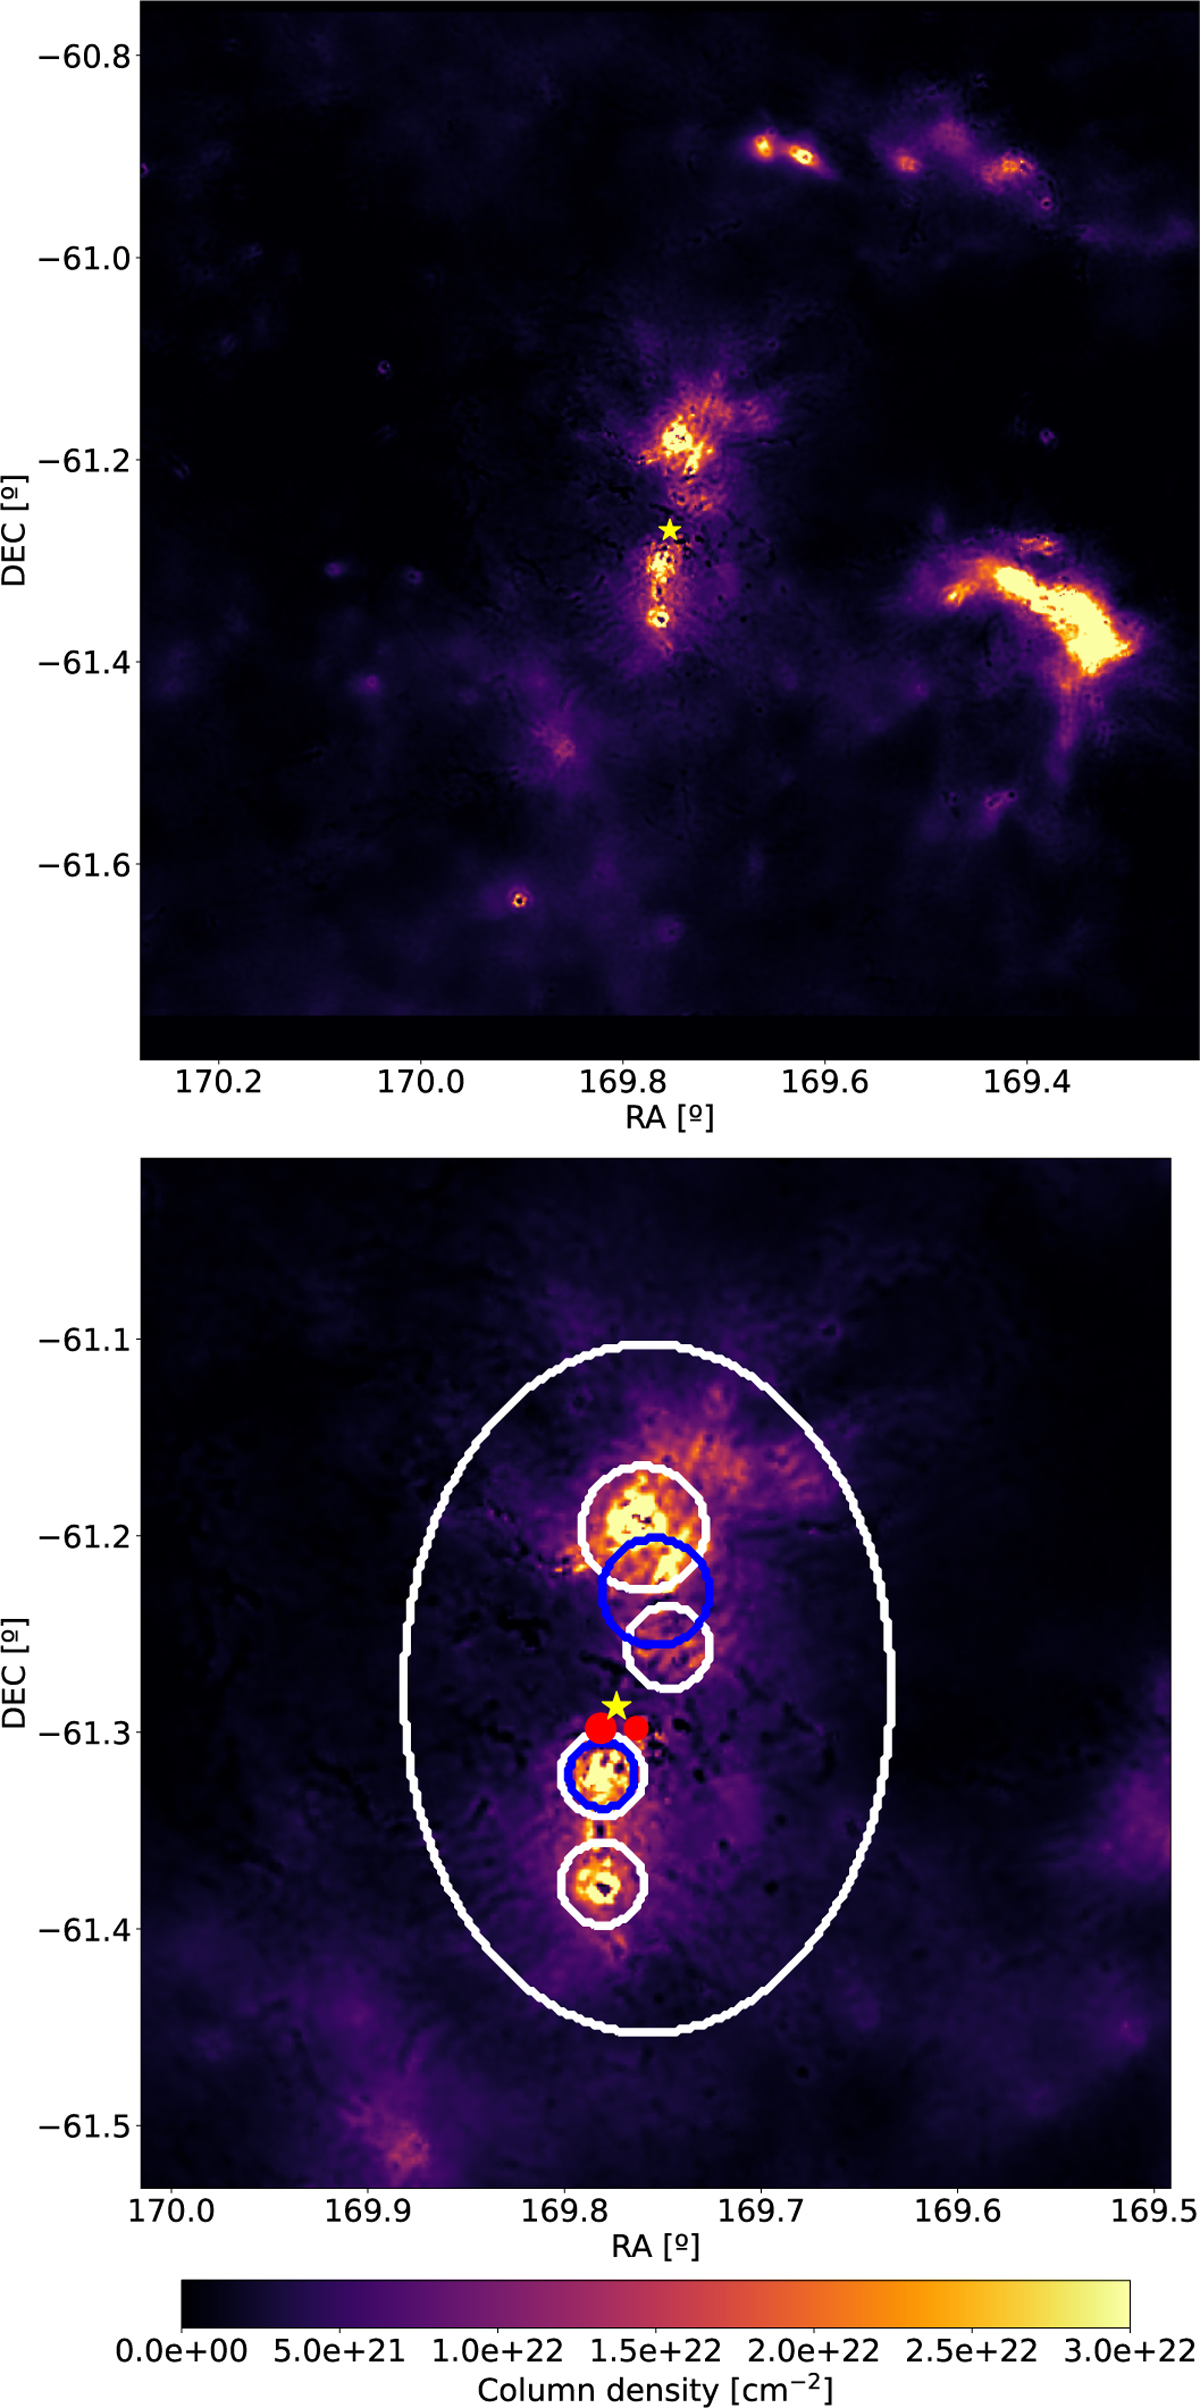
Molecular gas column density in the NGC 3603 region (top) and zoomed central region (bottom). The yellow star marks the position of the stellar cluster. The size of the upper map represents the size of the simulation box. White circles and ellipses show the molecular clouds introduced in our simulation box, blue circles show the position of the atomic clouds, and filled red circles show the ionized gas.
Current usage metrics show cumulative count of Article Views (full-text article views including HTML views, PDF and ePub downloads, according to the available data) and Abstracts Views on Vision4Press platform.
Data correspond to usage on the plateform after 2015. The current usage metrics is available 48-96 hours after online publication and is updated daily on week days.
Initial download of the metrics may take a while.