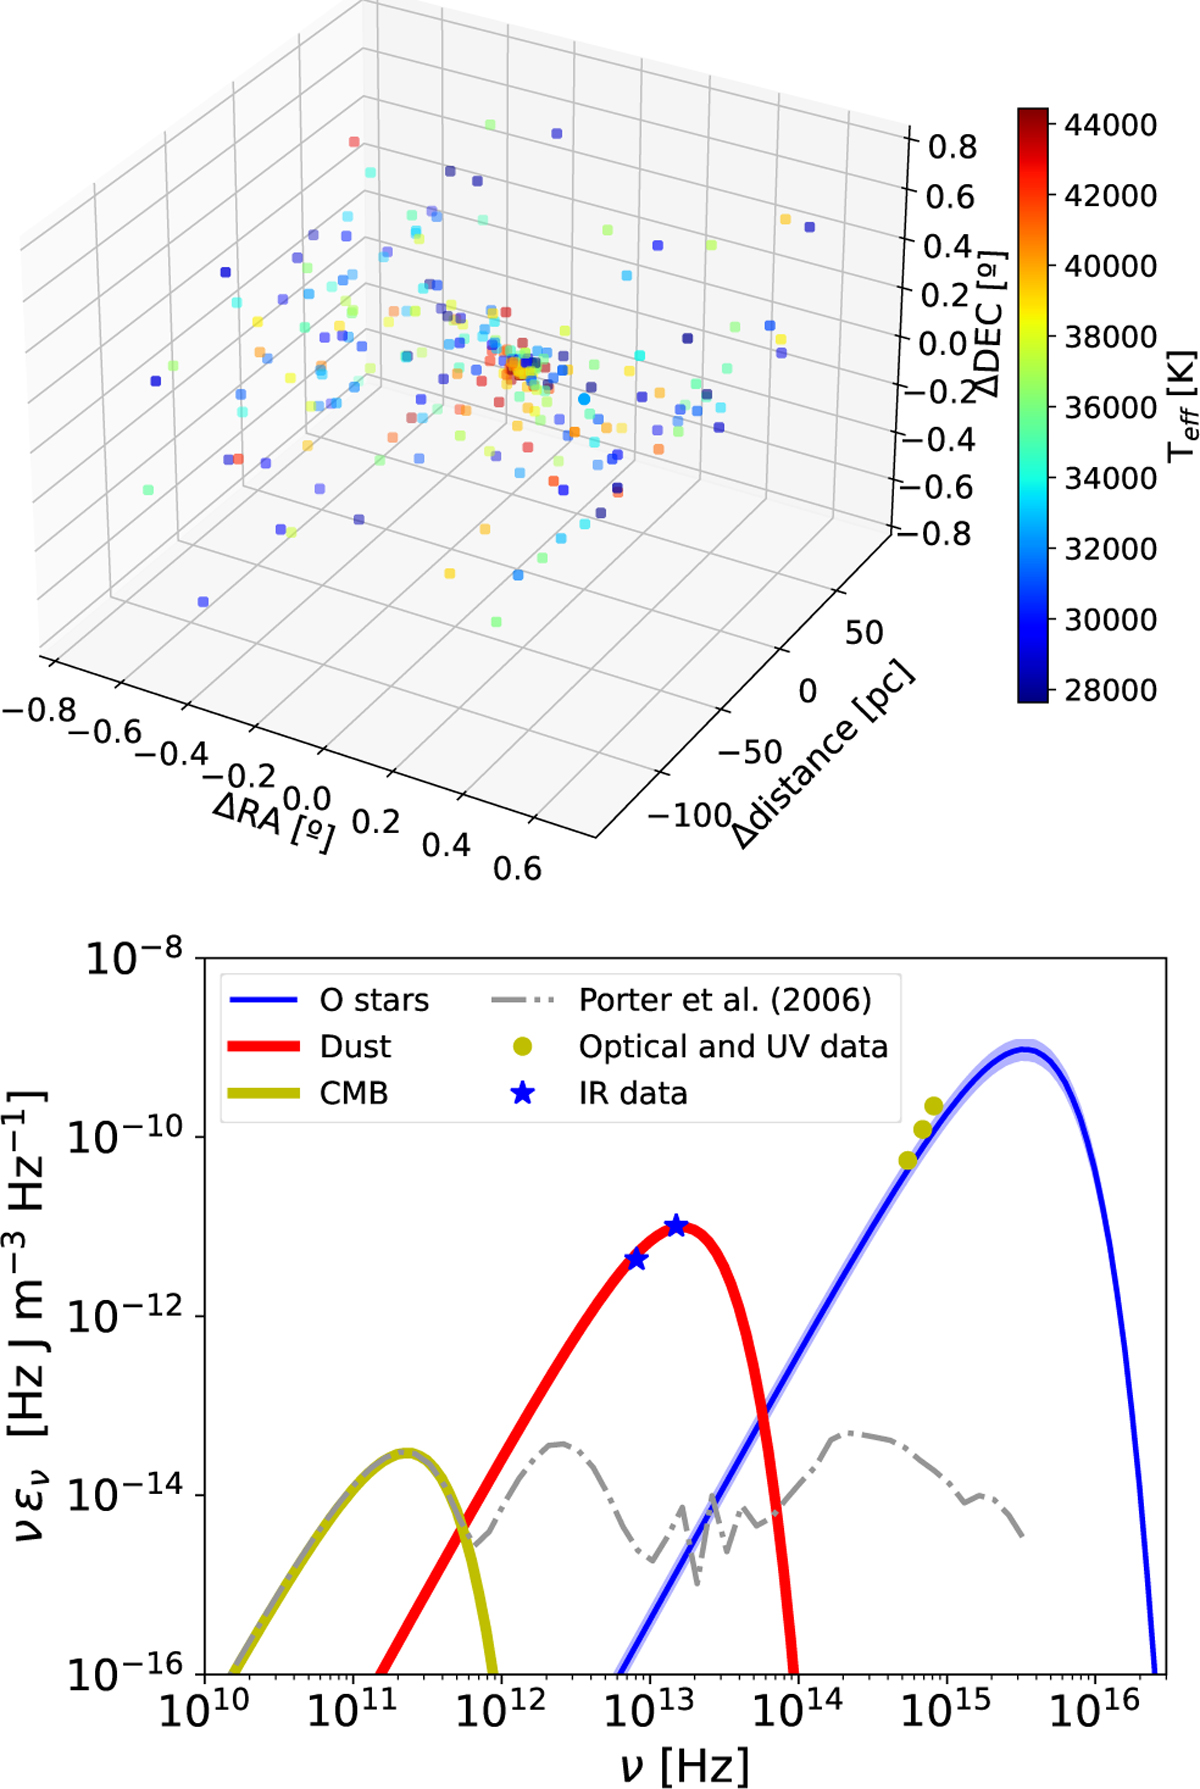
Fig. 1
Download original image
3D distribution of O stars in our model (top) and radiation field density at the centre of the simulation box (bottom). Colours in the top panel represent the effective temperature of the stars. The yellow data points in the lower panel are from Sher (1965), blue stars show the data from De Buizer et al. (2024). The blue shaded band shows the uncertainty in the stars’ radiation component, while the gray dash-dotted line shows the Galactic ISRF model from Porter & Strong (2005).
Current usage metrics show cumulative count of Article Views (full-text article views including HTML views, PDF and ePub downloads, according to the available data) and Abstracts Views on Vision4Press platform.
Data correspond to usage on the plateform after 2015. The current usage metrics is available 48-96 hours after online publication and is updated daily on week days.
Initial download of the metrics may take a while.