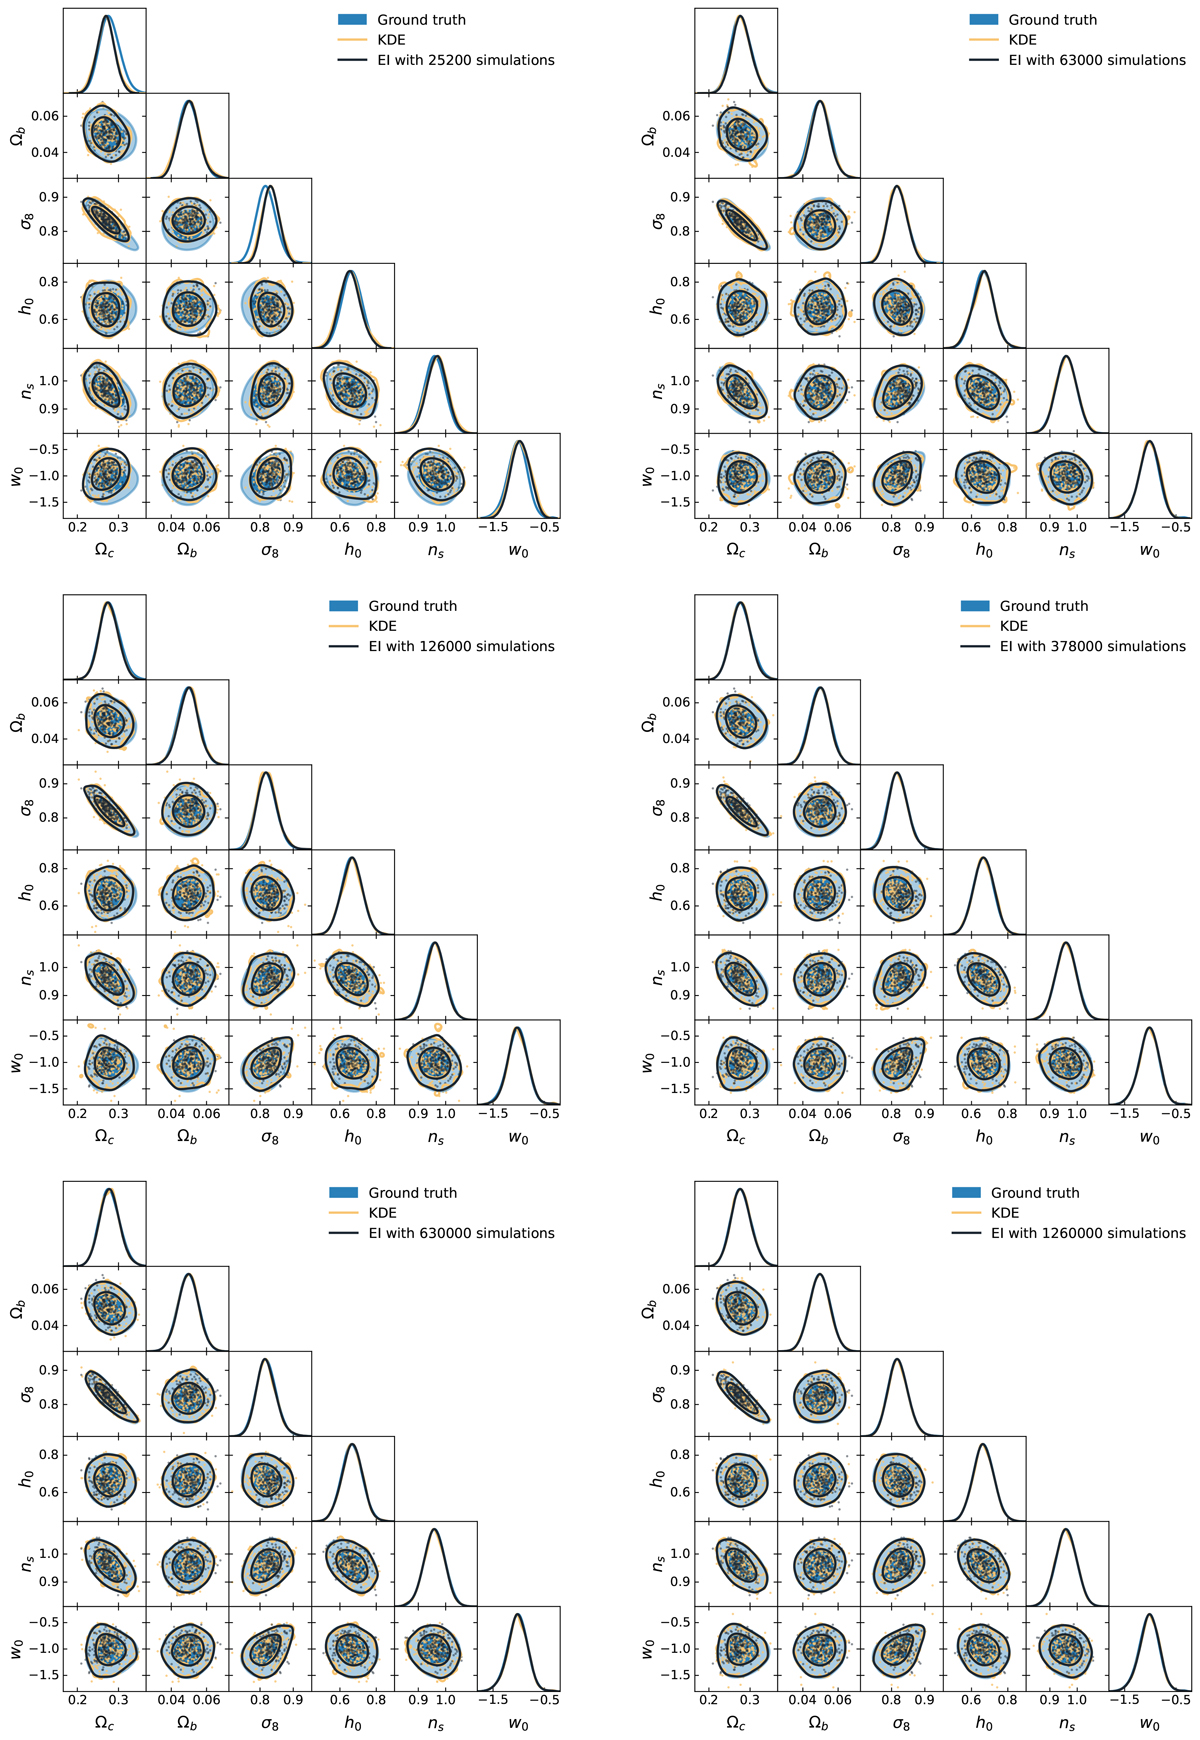
Fig. E.7.
Download original image
Samples of the KDE used to compute C2ST metric. In this paper we use the C2ST metric to evaluate the convergence of inference methods. This metric requires an equal number of simulations of the two distributions to be compared. To use the C2ST metric to benchmark the explicit inference method, inspired by the construction of contour plots that smooth the distribution (such as the one proposed by GetDist), we use a KDE to generate new samples. Specifically, we use a Gaussian kernel and set the bandwidth to match what GetDist would display for every number of explicit inference posterior samples (black contours). The yellow contours correspond to the contours obtained when fitting the N samples of explicit inference posterior and generating 20 000 samples from the KDE. We use a very small smoothing scaling value to display the posterior contours of the KDE with GetDist. The blue contours denote the ground truth of 160 000 samples.
Current usage metrics show cumulative count of Article Views (full-text article views including HTML views, PDF and ePub downloads, according to the available data) and Abstracts Views on Vision4Press platform.
Data correspond to usage on the plateform after 2015. The current usage metrics is available 48-96 hours after online publication and is updated daily on week days.
Initial download of the metrics may take a while.