Fig. E.5.
Download original image
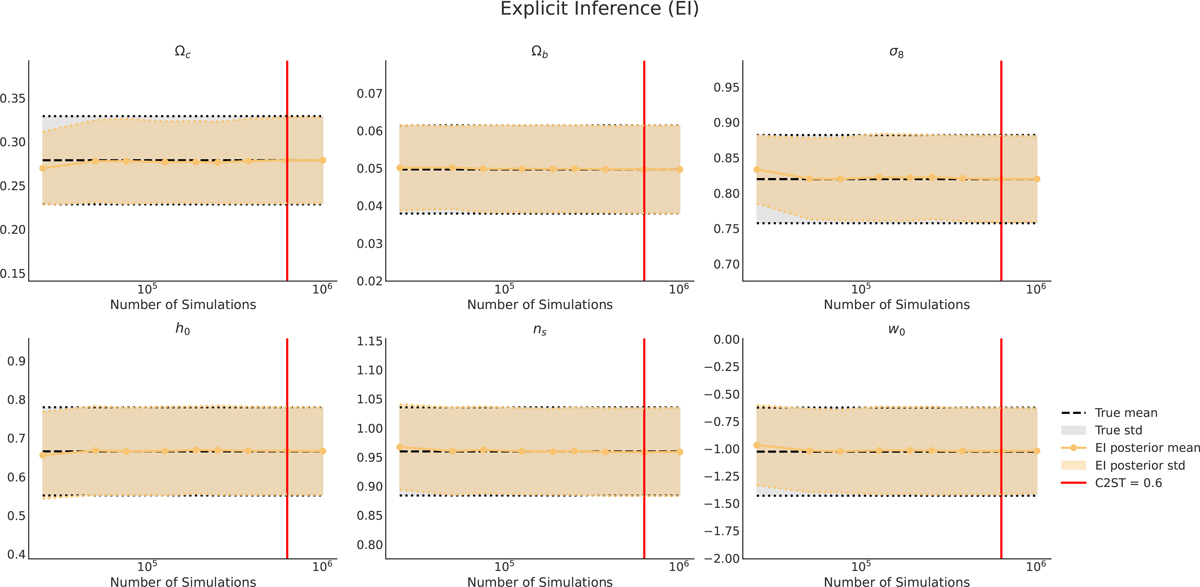
Evolution of the mean and standard deviation of the explicit inference posterior as a number of simulations. To get our 160 000 posterior samples (our ground truth) we use the NUTS algorithm. For each simulation budget N, we select the first N samples of this ground truth and compute its mean and standard deviation. The yellow line and dotted line correspond respectively to the mean and standard deviation. The black dashed line corresponds to the mean of the ground truth (of 160 000 posterior samples), and the black dotted line to its standard deviation. The red line corresponds to the number of simulations for which the C2ST is equal to 0.6 (i.e. assume that the posterior is converged). Note that the C2ST can compare ”higher moments” than the first and second moments of two distributions thus these plots cannot serve as direct conclusions.
Current usage metrics show cumulative count of Article Views (full-text article views including HTML views, PDF and ePub downloads, according to the available data) and Abstracts Views on Vision4Press platform.
Data correspond to usage on the plateform after 2015. The current usage metrics is available 48-96 hours after online publication and is updated daily on week days.
Initial download of the metrics may take a while.