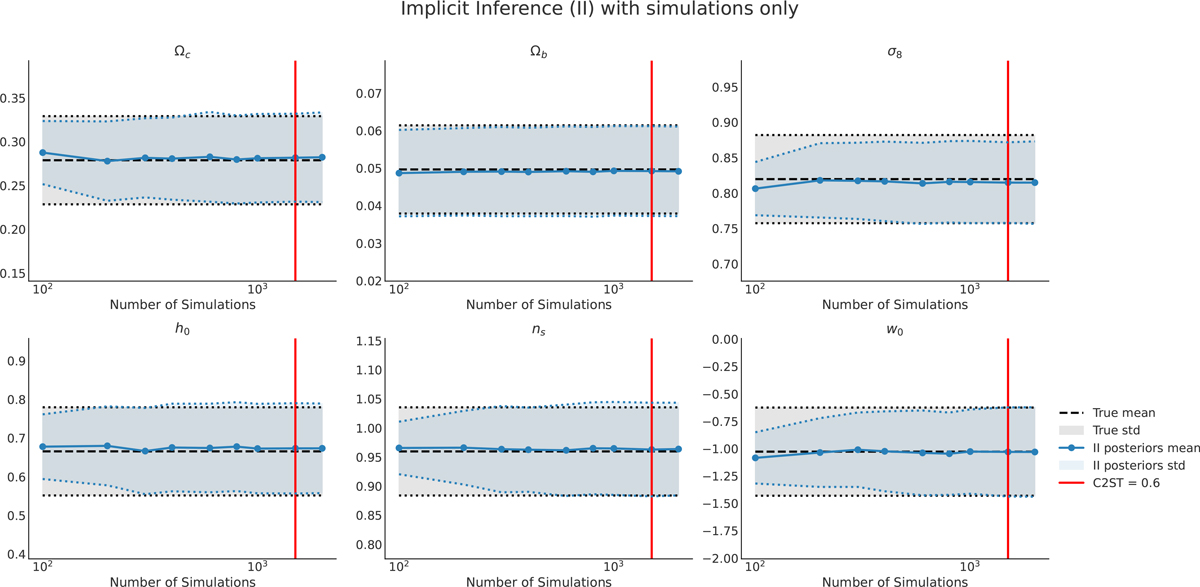
Fig. E.2.
Download original image
Evolution of the mean and standard deviation of the approximated implicit inference posterior as a number of simulations. The posterior is approximated using the NLE method with only simulations. We train five NFs with the same architecture where only the initialization of the weights of the NF changes. The blue line corresponds to the mean of the five approximated posteriors and the dotted line to the standard deviation. The dashed line corresponds to the mean of the ground truth (the explicit inference posterior of 160 000 samples), and the black dotted line to its standard deviation. The red line corresponds to the number of simulations for which the C2ST is equal to 0.6 (i.e. assume that the posterior is converged). Note that the C2ST can compare ”higher moments” than the first and second moments of two distributions thus these plots cannot serve as direct conclusions.
Current usage metrics show cumulative count of Article Views (full-text article views including HTML views, PDF and ePub downloads, according to the available data) and Abstracts Views on Vision4Press platform.
Data correspond to usage on the plateform after 2015. The current usage metrics is available 48-96 hours after online publication and is updated daily on week days.
Initial download of the metrics may take a while.