Open Access
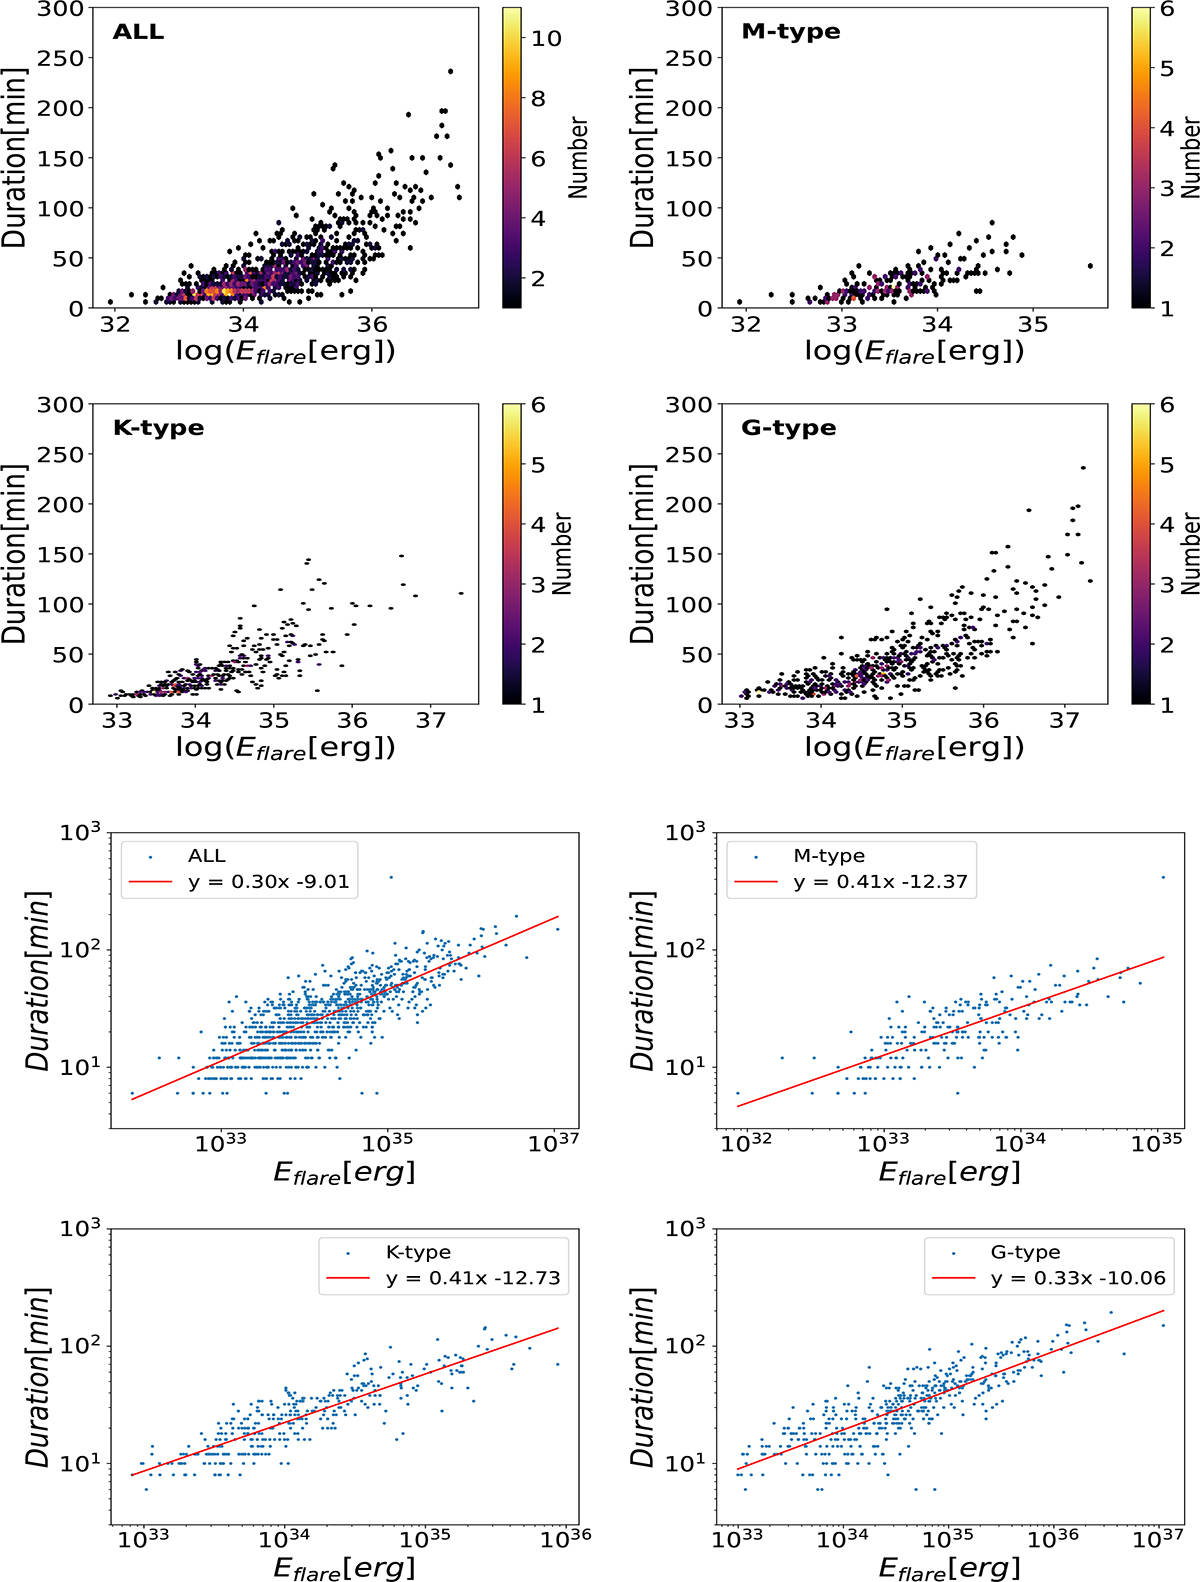
Fig. 9.
Download original image
Relationship between flare energy and duration for stars of different spectral types. The colour bar indicates the number density in the upper panels, while the solid red line represents the fitting result in the lower panels.
Current usage metrics show cumulative count of Article Views (full-text article views including HTML views, PDF and ePub downloads, according to the available data) and Abstracts Views on Vision4Press platform.
Data correspond to usage on the plateform after 2015. The current usage metrics is available 48-96 hours after online publication and is updated daily on week days.
Initial download of the metrics may take a while.