Open Access
Fig. 7.
Download original image
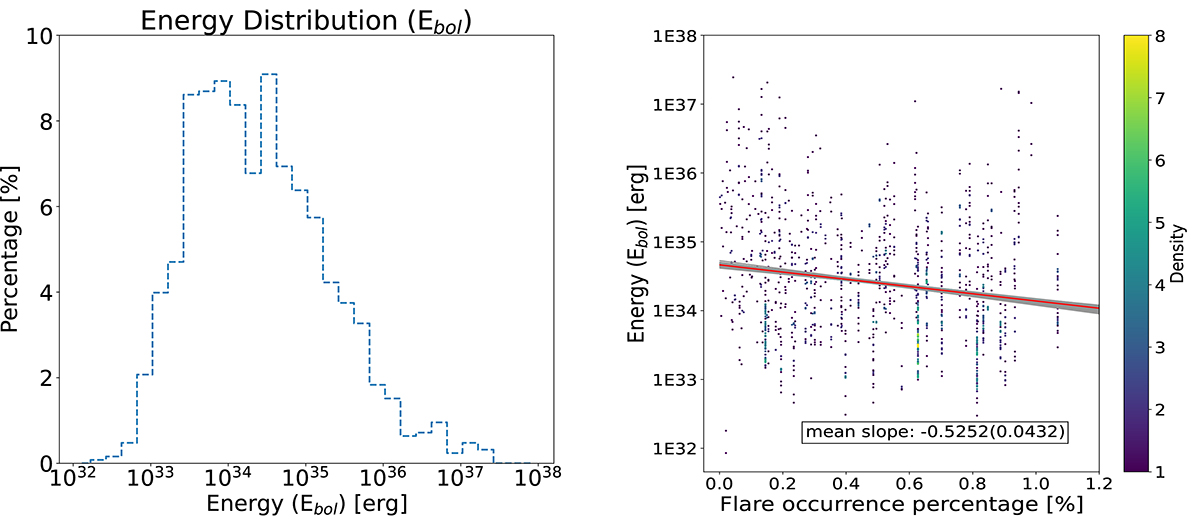
Left panel: Distribution of bolometric flare energy across various energy ranges, with the majority of events concentrated between 1034 to 1035 erg. Right panel: Relationship between flare energy and percentage of flare occurrence. A linear trend fitted using the MCMC method.
Current usage metrics show cumulative count of Article Views (full-text article views including HTML views, PDF and ePub downloads, according to the available data) and Abstracts Views on Vision4Press platform.
Data correspond to usage on the plateform after 2015. The current usage metrics is available 48-96 hours after online publication and is updated daily on week days.
Initial download of the metrics may take a while.