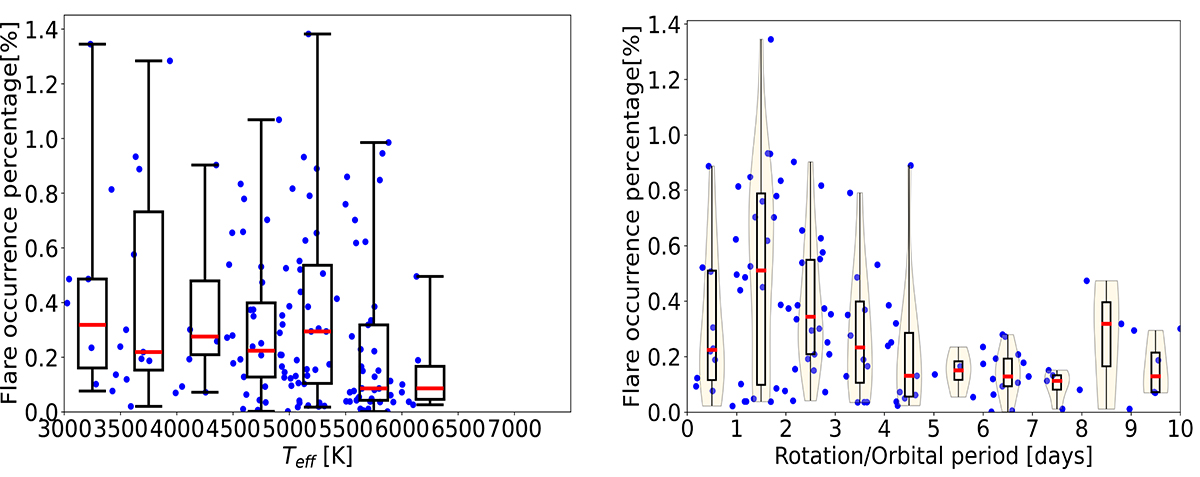
Fig. 5.
Download original image
Distribution of flare occurrence percentages across different effective temperature and orbital period ranges. Left panel: Relationship between effective temperature and flare occurrence percentage, with box-and-whisker plots overlaid. Right panel: Relationship between orbital period and flare occurrence percentage, also with violin plots overlaid with box-and-whisker plots. In each panel, blue dots represent the effective temperature or orbital period, along with the corresponding flare occurrence percentage for each star. The horizontal lines of the box plot represent the positions of the quantiles. The upper horizontal line represents the third quartile (3/4), the lower horizontal line represents the first quartile (1/4), and the red line represents the median, while the violin plot shows the distribution shape (in light yellow).
Current usage metrics show cumulative count of Article Views (full-text article views including HTML views, PDF and ePub downloads, according to the available data) and Abstracts Views on Vision4Press platform.
Data correspond to usage on the plateform after 2015. The current usage metrics is available 48-96 hours after online publication and is updated daily on week days.
Initial download of the metrics may take a while.