Fig. 17.
Download original image
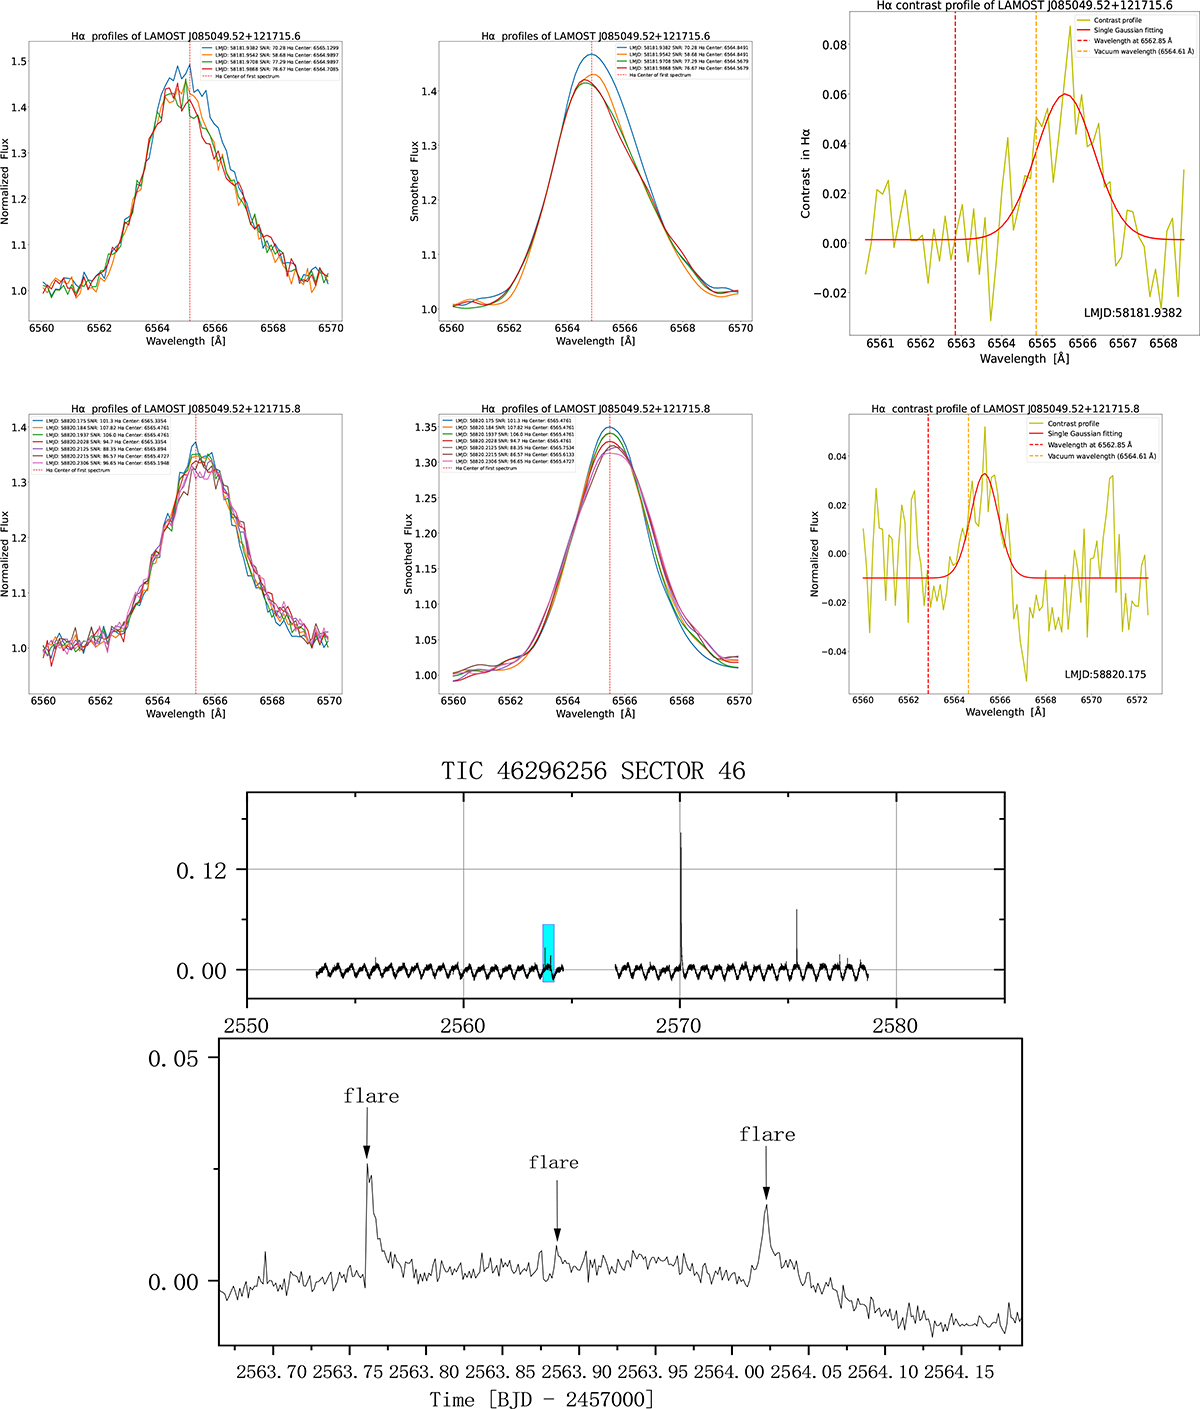
Photometric and spectroscopic images. Top two sets of panels: Normalized (left) and smoothed (middle) Hα profiles, and (right) single Gaussian fitting results for the Hα contrast profile of the active spectrum. The corresponding names from top to bottom are LAMOST J085049.52+121715.6 and J085049.52+121715.8. In the legend, LMJD, S/R, and Hα peak positions are provided, with the peak position of the first spectrum indicated by the dashed red line. The solid yellow line represents the Hα contrast profile and the single Gaussian fitting result is depicted by the solid red line. The dotted vertical red and orange lines indicate the wavelengths of the Hα line at 6562.85 Å and the vacuum wavelength at 6564.61 Å, respectively. Bottom panels: Light curve of TIC 46296256 in sector 46, and a zoom-in view of the blue region in the light curve.
Current usage metrics show cumulative count of Article Views (full-text article views including HTML views, PDF and ePub downloads, according to the available data) and Abstracts Views on Vision4Press platform.
Data correspond to usage on the plateform after 2015. The current usage metrics is available 48-96 hours after online publication and is updated daily on week days.
Initial download of the metrics may take a while.