Fig. 11.
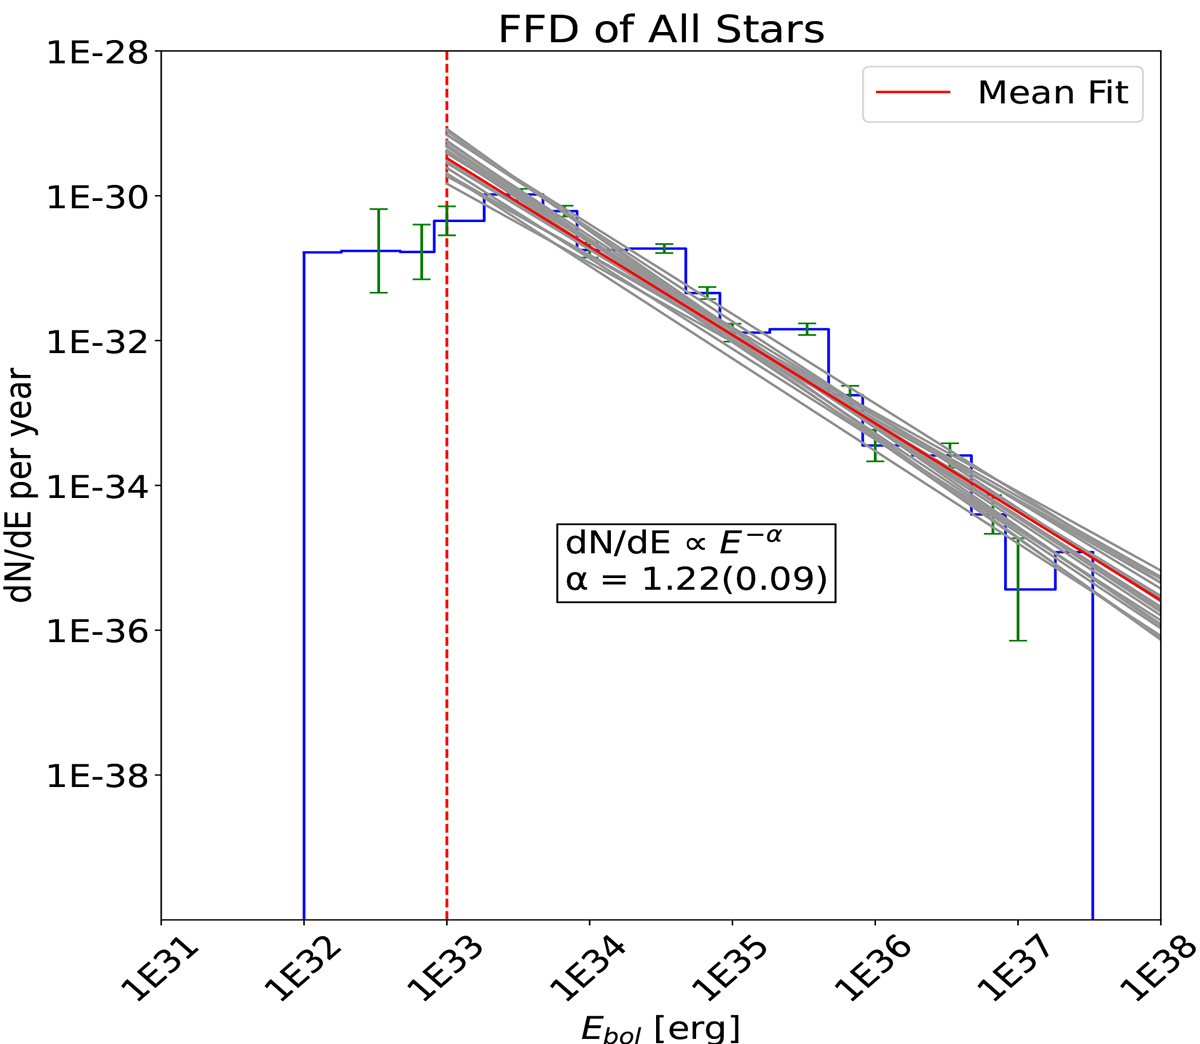
Download original image
Calculated alpha values for the flare frequency distribution within the energy range of 1033 to 1037 erg using the MCMC method. The green error bars represent the statistical uncertainty, derived as the square root of the total number of flares within each energy range. The dashed vertical red line represents that the fitting energy starts from 1033 ergs. The grey lines represent predictive samples from posterior distributions, while the red line represents the mean trend determined by calculating the average fitted slope and its uncertainty. For the entire sample of flaring stars, the alpha value is found to be approximately 1.22.
Current usage metrics show cumulative count of Article Views (full-text article views including HTML views, PDF and ePub downloads, according to the available data) and Abstracts Views on Vision4Press platform.
Data correspond to usage on the plateform after 2015. The current usage metrics is available 48-96 hours after online publication and is updated daily on week days.
Initial download of the metrics may take a while.