| Issue |
A&A
Volume 698, June 2025
|
|
|---|---|---|
| Article Number | A91 | |
| Number of page(s) | 7 | |
| Section | Galactic structure, stellar clusters and populations | |
| DOI | https://doi.org/10.1051/0004-6361/202554206 | |
| Published online | 04 June 2025 | |
The Galactic inner spiral arms revealed by the Gaia ESO Survey chemical abundances
Metallicity and [Mg/Fe] ratios
1
Institute of Theoretical Physics and Astronomy, Vilnius University,
Sauletekio av. 3,
10257
Vilnius,
Lithuania
2
INAF – Osservatorio Astrofisico di Arcetri,
Largo E. Fermi 5,
50125,
Firenze,
Italy
3
INAF, Osservatorio Astronomico di Trieste,
Via Tiepolo 11,
34143
Trieste,
Italy
4
IFPU, Institute for Fundamental Physics of the Universe,
Via Beirut 2,
34151
Trieste,
Italy
5
Dipartimento di Fisica, Sezione di Astronomia, Università di Trieste,
Via G. B. Tiepolo 11,
34143
Trieste,
Italy
6
INFN, Sezione di Trieste,
Via A. Valerio 2,
34127
Trieste,
Italy
7
Como Lake centre for AstroPhysics (CLAP), DiSAT, Università dell’Insubria,
via Valleggio 11,
22100
Como,
Italy
★ Corresponding author: This email address is being protected from spambots. You need JavaScript enabled to view it.
Received:
21
February
2025
Accepted:
23
April
2025
Abstract
Context. The spiral structure of the Milky Way has traditionally been mapped using stellar density, kinematics, and gas distribution. However, chemical abundances – especially in the inner Galaxy – remain a relatively under-explored tracer, offering valuable insights into its formation and evolution. Recent observational advances, such as Gaia DR3 GSP-Spec, have highlighted the potential of chemical abundances in tracing and revealing the structure of spiral arms.
Aims. Building on these studies, we aim to trace the Milky Way’s inner spiral arms using chemical abundance data from the Gaia-ESO Survey. By mapping over-densities in [Fe/H] and [Mg/Fe], we seek to identify spiral arms in both radial and vertical planes, detect substructures, and compare our results with recent Galactic chemical evolution models.
Methods. We used chemical abundance data from the Gaia-ESO Survey to create spatial maps of [Fe/H], [Mg/H], and [Mg/Fe] excess across the Galactic inner disc. The maps were analysed to detect over-densities associated with known spiral arms. We compared our results with recent spiral arm models.
Results. For the first time, the inner spiral arms have been revealed using chemical abundance patterns. We detect [Fe/H] enhancements and [Mg/Fe] under-abundances that consistently trace the Scutum and Sagittarius arms. A spur connecting these arms is observed in the [Mg/H] plane. The alignment between our observations and the results of our 2D chemical evolution models reinforces the significance of spiral arm transits in driving both azimuthal and radial variations in chemical abundances.
Conclusions. Our results confirm that spiral arms can be traced using stellar chemical abundances with Gaia-ESO data, providing a new perspective on the structure of the inner Galaxy. The consistency between higher [Fe/H] and lower [Mg/Fe] ratios, as observed in previous studies, further supports our findings. The observed spur, bifurcation, and vertical substructures align well with recent models and studies, indicating that chemical maps can significantly contribute to our understanding of Galactic spiral arms.
Key words: Galaxy: abundances / Galaxy: disk / Galaxy: evolution / Galaxy: stellar content / Galaxy: structure
© The Authors 2025
 Open Access article, published by EDP Sciences, under the terms of the Creative Commons Attribution License (https://creativecommons.org/licenses/by/4.0), which permits unrestricted use, distribution, and reproduction in any medium, provided the original work is properly cited.
This article is published in open access under the Subscribe to Open model. This email address is being protected from spambots. You need JavaScript enabled to view it. to support open access publication.
1 Introduction
Spiral arms play a crucial role in shaping the chemical evolution of disc galaxies, and observations of external galaxies have revealed enhanced metallicity within the arms compared to the inter-arm regions (see e.g. Sánchez-Menguiano et al. 2020). Moreover, the spiral structure can influence metallicity not only on a local scale but also across larger distances (see e.g Lépine et al. 2011).
Recent advancements in astrometric and photometric data from the Gaia mission have significantly enhanced our understanding of the Milky Way’s spiral structure and its chemical evolution. Poggio et al. (2021) utilized the Gaia Early Data Release 3 (Gaia Collaboration 2021) to map the density variations of young upper main sequence stars, open clusters (OCs), and classical Cepheids within a few kiloparsecs of the Sun (see also Ge et al. 2024; Castro-Ginard et al. 2021; Lemasle et al. 2022). Their findings reveal coherent large-scale arches corresponding to spiral arm segments, notably suggesting an extended Local Arm stretching at least 8 kpc from the Sun. Building on this, Poggio et al. (2022) utilized the Gaia Data Release 3 (DR3; Gaia Collaboration 2023) and Gaia DR3 General Stellar Parametrizer Spectroscopy (GSP-Spec; Recio-Blanco et al. 2023) to uncover chemical inhomogeneities in the Galactic disc, identifying metal-rich features aligned with spiral arms. These chemical signatures are particularly pronounced in younger stellar populations, underscoring the crucial role of the spiral arms in shaping the Galaxy’s chemical landscape. Additionally, Barbillon et al. (2025) extended this work by examining azimuthal variations in [Ca/Fe] and [Mg/Fe], revealing distinct chemical signatures linked to the spiral arms, such as those associated with the Sagittarius-Carina and Local arms. Their analysis reveals lower levels of [α/Fe] in young stars within spiral arms compared to inter-arm regions, attributed to increased iron production within the arms. The [Mg/Fe] ratio, or [α/Fe] more generally, is a valuable tracer of star formation history, as magnesium is predominantly produced by core-collapse (Type II) supernovae on short timescales (e.g. Chieffi & Limongi 2004, 2013; Higgins et al. 2023), while iron has significant contributions from Type Ia supernovae on longer timescales (see e.g. Nomoto et al. 2013). Variations in the [Mg/Fe] ratio across different galaxies or Galactic populations – such as the thin and thick discs, halo, and bulge – reflect differences in their star formation efficiencies and chemical evolution, with higher [Mg/Fe] ratios typically indicating more rapid star formation.
In addition to studies of the chemical composition of spiral arm regions, further works based on stellar density, stellar tracers of different ages, and kinematics have increased our knowledge of the spiral pattern, especially on a local scale (see e.g. Rezaei Kh. et al. 2018; Khoperskov & Gerhard 2022; Lin et al. 2022; Ge et al. 2024; Widmark & Naik 2024). For instance, Reid et al. (2019) found evidence in favour of a four-arm spiral model by compiling trigonometric parallaxes of molecular masers in highmass star-forming regions, whereas Lemasle et al. (2022) and Drimmel et al. (2024) utilized classical Cepheids and young supergiants to trace the spiral arms at even greater distances, deriving updated parameters for the Galactic warp. Complementing these works, Alinder et al. (2024) analysed the twoarmed phase spiral within the solar neighbourhood using Gaia DR3 data, uncovering its distinct rotational behaviour and chemical signature compared to the one-armed phase spiral. Recent studies have revealed that nova systems, which produce ∼75% of the Galaxy’s 26Al, dampen the Milky Way’s spiral arm pattern; this highlights their critical role in the Galaxy’s chemical evolution alongside massive stars (Vasini et al. 2025). Together, these studies provide new insights into the Galaxy’s spiral architecture and the complex history of dynamical disturbances in its disc. From a dynamical point of view, Palicio et al. (2023) utilized Gaia DR3 radial velocity data and radial actions to identify spiral-like features in the Galactic disc, revealing arc-like segments and high radial action (JR) regions, such as one around RGC=10.5 kpc potentially linked to the outer Lindblad resonance. Their work highlights the consistency between the dynamics of older stars and the spiral arms traced by younger populations, highlighting the complex interplay between Galactic structure and stellar motion.
Complementing the observational insights, Spitoni et al. (2023) developed a set of advanced 2D chemical evolution models that incorporate multiple spiral-arm patterns with varying pattern speeds. Those models successfully reproduce the azimuthal variations in the abundance gradients of elements like oxygen, iron, europium, and barium. They underscore the influence of distinct spiral modes on the distribution of chemically enriched materials in the disc, aligning well with the chemical inhomogeneities observed by Poggio et al. (2021).
In the present work, we took advantage of the spectroscopic data of the Gaia-ESO Survey (GES; Randich et al. 2022; Gilmore et al. 2022) to investigate the azimuthal variations in metallicity and abundances, and their correlation with the spiral pattern. The Gaia-ESO data allowed us to investigate the innermost regions of the disc, namely the Scutum and Norma spiral arms. Furthermore, the results can be compared with those of previous studies, given the good agreement of Gaia GSP-Spec with GES (Van der Swaelmen et al. 2024).
In Sect. 2, we describe the dataset used in this study, focusing on the chemical abundance measurements provided by GES and their spatial coverage across the Galactic disc. Section 3 presents metallicity and abundance ratio excess maps. In Sect. 4, we explore the residual abundance variations across Galactic longitudes, highlighting key trends and their potential connection to the spiral structure of the inner Galaxy in comparison with recent models. Finally, Sect. 5 summarizes our findings and discusses their implications for our understanding of the chemical and structural evolution of the Galactic disc.
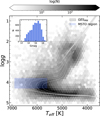 |
Fig. 1 Kiel diagram showing the distribution of GE_MW and GE_MW_BL stars in the Teff-log g plane. The background grey-scale density plot represents the full sample of GE_MW and GE_MW_BL stars, with a logarithmic binning. The blue-shaded rectangle highlights the region used to select MSTO stars. The inset shows the distribution of Gaia G magnitudes for the selected stars. In light grey we show grids of PARSEC isochrones (Bressan et al. 2012), with log(age/yr) from 9.0 to 10.0 at solar metallicity. |
2 Dataset
Using the latest release of GES, which includes approximately 114 000 unique targets (Hourihane et al. 2023), we initially selected around ∼63 000 stars in the Galactic fields, identified with GES_TYPE = GE_MW, including approximately ∼6000 stars located in the Galactic Bulge, classified as GES_TYPE = GE_MW_BL. These stars were observed with both GIRAFFE (Grating Instrument for Radiation Analysis with a Fibre Fed Échelle) at medium resolution (R = 20 000) and UVES (Ultraviolet and Visual Echelle Spectrograph) at high resolution (R= 47 000). From this subset, we further narrowed down our selection including only main sequence turnoff (MSTO) stars (see Fig. 1), following the criteria set in Viscasillas Vázquez et al. (2023), and retained only those with typical thin disc metallicity, [Fe/H] > −0.5, reducing the sample to around ∼5000 field stars (∼73% of them were observed with GIRAFFE HR10 and/or HR21 setups and ∼27% with UVES U580). This selection allows us to more accurately map the spiral structure, as the selected stars are expected to be younger, more metal-rich, and predominantly located in the Galactic thin disc, the region where spiral structures are most prominent. Approximately 66% of them are located in the 4th Galactic quadrant (270∘ ≤ ℓ ≤360∘), 25% in the 3th (180∘ ≤ ℓ ≤ 270∘) and 73% are located in the combined first (0∘ ≤ ℓ ≤ 90∘) and fourth Galactic quadrants (270∘ ≤ ℓ ≤. 360∘). In Fig. 2, we show the distribution of our sample both on the Galactic plane and in the vertical direction, above and below the plane. The distribution of our sample of field stars enables us to map not only the Sagittarius arm but also the inner arms, such as the Scutum arm and even up to the Norma arm, complementing other studies that focus mainly on the outer regions of the Galaxy (Poggio et al. 2021, 2022; Spitoni et al. 2023; Barbillon et al. 2025). The sub-panel in Fig. 1 also displays the G magnitude distribution of our selected sample: the brightest stars were observed with UVES, while the faintest ones were reached with GIRAFFE. We computed ages of MSTO field stars using the AUSSIEQ2 code1, based on the original Q2 code from Ramírez et al. (2014), which derives stellar ages and masses comparing stellar parameters with a grid of isochrones.
Additionally, we incorporated a sample of 62 OCs as defined in Viscasillas Vázquez et al. (2022) and Magrini et al. (2023). Heliocentric Cartesian coordinates of the field sample were taken from Candebat et al. (2024) and for the OCs, they were computed in this work using the Galpy code (Bovy 2015).
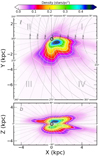 |
Fig. 2 Density plot of approximately ∼5000 MSTO field stars with metallicity [Fe/H] > −0.5. The plot shows the Galactic coordinate system projected onto the XY plane. Lines of constant Galactic longitude (ℓ) and latitude (b) are drawn at regular intervals, while concentric circles represent increasing Galactocentric distances (R). The four Galactic quadrants are also indicated, providing a reference for the spatial distribution of structures within the Milky Way. The colour bar shows the stellar density in physical units of numbers of stars per square parsec (stars/pc2). |
3 Metallicity and abundance ratio excess maps
The distribution of stars along the line of sight from the Sun, together with the limited sample size, makes it challenging to discern the spiral arms from stellar density alone. To address this, we constructed smooth, continuous maps of [Fe/H], [Mg/Fe], and [Mg/H] excesses in two projections (XY and XZ), computed using the methodology detailed below. First, we interpolated the original dataset using the griddata function from SCIPY (Virtanen et al. 2020). Then, we generated uniform grids for each projection and applied linear interpolation to estimate the abundance values across these grids. To reduce noise and emphasize spatial patterns, we applied a Gaussian filter from SCIPY, ensuring the resulting maps were clearer and more representative of large-scale trends (a similar approach is used in e.g. Alinder et al. 2024). The overlaid spiral arm model is based on the framework proposed by Drimmel et al. (2024). Finally, to highlight localized variations, we computed excess maps for [Fe/H], [Mg/Fe], and [Mg/H] following the approach described by Poggio et al. (2022). For each abundance ratio, we smoothed the data at two scales using Gaussian filters: a finer scale (σ = 7) to capture local variations and a broader scale (σ = 21) to represent global trends, where σ is the standard deviation of the Gaussian kernel. By subtracting the global trend map from the locally smoothed map, we isolated regions of significant deviations, effectively identifying areas of localized enrichment or depletion in [Fe/H], [Mg/Fe] and [Mg/H]. This method inherently reduces the spatial coverage of the excess map, as smooth large-scale structures are removed by construction.
In the case of [Fe/H], these excess maps reveal subtle chemical inhomogeneities within the Galactic disc (see Fig. 3). Based on their positions, they appear to correspond to the Sagittarius, Scutum, and Norma arms. On the maps, they appear with a width consistent with the typical estimated range of ∼500−2000 pc (see e.g. Vallée 2014; Reid et al. 2019). In contrast, when examining the same figure in terms of [Mg/Fe] excess (see Fig. 4), we find that the regions associated with the spiral arms appear depleted in [Mg/Fe]. This depletion suggests that while these regions exhibit localized enrichment in iron, they are poorer in magnesium compared to their surroundings. This effect is particularly evident in the vertical view of the referenced figure. Our findings align with those of Barbillon et al. (2025), which indicate enhanced iron production in spiral arms. Similarly, the magnesium excess maps (see Fig. 5) reveal regions with significant deviations in [Mg/H], offering insights into the differential enrichment processes that may be influencing various areas.
The figures also reveal a potential substructure or bifurcation of the Scutum Arm at a Galactic longitude of approximately ℓ = 320∘ and at Y = ∼−3 kpc, in the IV quadrant. This appears to produce a splitting into an inner and outer sub-arm. These types of extensions are frequently found in observed multi-armed galaxies. Indeed, the Scutum Arm together with the Perseus Arm are considered the primary arms of the Galaxy, while the Norma and Sagittarius arms are secondary (e.g. Vallée 2016). This splitting of one main arm into two seems to align with the findings of Xu et al. (2023), who used masers and high-mass star-forming regions to identify similar structures. However, the authors of that study consider two major spiral arms, the Norma and Perseus Arms. In that case, Scutum would be a fork of the Norma Arm. Models also suggest that in a initially two-arm structure near the Galactic Centre, each inner arm undergoes a bifurcation, resulting in two additional gaseous arms beyond (see e.g. Pérez-Villegas et al. 2015). This bifurcation at a galactocentric distance of ∼5 kpc also appears to be seen in Model 3 of Vislosky et al. (2024), and the Scutum–Centaurus spiral arm appears connected to the bar’s near side. Furthermore, when we look at the maps in the [Mg/H] plane (see Fig. 5), we can see branches or bridges that go from one spiral arm to another. Particularly, in addition to distinguishing the arms at low Y coordinates, we can see what appears to be a connection between Sagittarius and Scutum at approximately ℓ = 280∘. Indeed, branches, spurs, and/or feathers are frequently observed in Sb-Sc galaxies, forming periodic structures associated with dust lanes, gas density peaks, and gravitational instabilities (see e.g. Elmegreen 1980; Dobbs & Bonnell 2006; La Vigne et al. 2006; Hou 2021 for a review).
Figure 3 also appears to show part of an interior substructure at ℓ = 330−340∘ and at a Galactocentric distance of about ∼4 kpc, which could correspond to the outermost part of Norma or even to the recently discovered feather by Veena et al. (2021), called the Gangotri wave. This feather is located at the same coordinates (see Fig. 4 of the aforementioned work). Finally, we note that the vertical view in our study suggests that the innermost arm or structure extends slightly below the Galactic plane, while the other inner arm remains closer to it, and the outermost structure lies slightly above. Additionally, there appears to be a gradual increase in the height of the spiral arms above the Galactic plane from the inside out, which may be consistent with the model of a warped Galaxy.
In addition to the field stars, we included the GES sample of OCs, which is a typical thin-disc population (see e.g. Van der Swaelmen et al. 2024). These clusters generally have relatively short lifespans and typically dissolve before reaching ages of a few billion years (see e.g. Viscasillas Vázquez et al. 2023, 2024). Figures 3, 4, and 5 illustrate that mature OCs (age > 0.5 Gyr) tend to be situated in the inter-arm regions, away from what seems to be the central core of the spiral arms. This pattern is especially evident in the vertical sections of the figures.
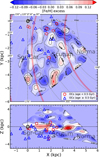 |
Fig. 3 Gaussian smoothing of the MSTO GES sample in Cartesian XY and XZ planes, colour-coded by metallicity excess. The overlaid spiral arm model follows the framework provided by Drimmel et al. (2024). The spatial distribution of star clusters is also shown, colour-coded by age – young clusters (<0.5 Gyr) as red circles and older clusters (≥0.5 Gyr) as blue triangles – plotted in the XY and XZ planes. |
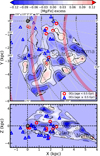 |
Fig. 4 Gaussian smoothing of the MSTO GES sample in Cartesian XY and XZ planes, colour-coded by [Mg/Fe] excess. The overlaid spiral arm model follows the framework provided by Drimmel et al. (2024). Black dots represent the subsample of thin discs with ages of less than 5 Gyr. |
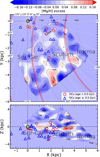 |
Fig. 5 Gaussian smoothing of the MSTO GES sample in Cartesian XY and XZ planes, colour-coded by [Mg/H] excess. The overlaid spiral arm model follows the framework provided by Drimmel et al. (2024). The spatial distribution of star clusters is also shown, colour-coded by age young clusters (<0.5 Gyr) as red circles and older clusters (≥0.5 Gyr) as blue triangles – plotted in the XY and XZ planes. |
4 Residual abundance variations across Galactic longitudes: Comparison with chemical evolution models
In the literature, several studies have modelled spiral arms as a superposition of multiple spiral density waves with varying pattern speeds (e.g. Tagger et al. 1987; Minchev et al. 2012). Spitoni et al. (2023) considered in the 2D chemical evolution model for the Galactic disc introduced by Spitoni et al. (2019) the spiral structure of the Milky Way as a combination of three distinct segments, each with different pattern speeds, to investigate their effects on the distribution of chemical elements in the Galactic disc. In their model, star formation is enhanced by the passage of spiral arms, leading to abundance fluctuations whose amplitudes depend on the specific chemical element considered. The most important result is that elements synthesized on short timescales (i.e. by short-lived progenitors) exhibit larger abundance variations, as they quickly reflect the influence of the spiral arm passage. In contrast, elements released into the interstellar medium after significant delays display smaller abundance variations. More recently, in Vasini et al. (2025) this model has been adopted to trace the 2D distribution of the short-lived radioisotope 26Al. In the spiral structures modelled in the 2D chemical evolution studies by Spitoni et al. (2023) and Barbillon et al. (2025), the authors also considered the possibility of co-rotating arms existing at all radii within transient spiral arm structures, as confirmed by various dynamical studies (Grand et al. 2012; Hunt et al. 2019). Supporting these findings, the recent analysis of star clusters by Liu et al. (2025) indicates that the spiral arm pattern speeds align with the Galactic rotation curve.
In particular, in this work, we present results in which for the last 1 Gyr (Model A+C3 of Spitoni et al. 2023) and 3 Gyr (Model 3 Gyr of Barbillon et al. 2025) we imposed the condition that all Galactocentric distances serve as loci of co-rotation. This approach is intended to mimic the potential transient nature of this structure. For a detailed description of the implementation of Galactic spiral arms in a 2D chemical evolution model and the adopted nucleosynthesis prescriptions, we refer the reader to Spitoni et al. (2023).
Figures 6 and 7 show the residuals of iron and magnesium abundances, Δ[Fe/H] and Δ[Mg/H], as a function of Galactic longitude (ℓ). Residuals were computed by subtracting the mean abundance for each azimuthal bin for the MSTO sample of ∼5500 stars. The median RGC value in our sample is 7.57 kpc with the first and third quartiles between 6.59 and 8.46 kpc. The dots represent binned residuals for the most sampled region of our data (∼6.5−8.5 kpc) with a fifth-order polynomial fit with a 95% confidence interval displayed around the regression line, while the overlaid lines correspond to chemical evolution models from Spitoni et al. (2023, upper panels) and Barbillon et al. (2025, lower panels) for different Galactocentric distances (between 7 and 9 kpc). Both plots reveal periodic variations in the residuals, which suggest the presence of underlying spiral structures influencing the chemical distribution in the Galactic disc. There is a notable gap in our data sample spanning Galactic longitudes between approximately 150∘ and 210∘. This gap is due to the observational strategy of GES (Gilmore et al. 2022). Fluctuations are observed across Galactic longitude, with a pronounced increase in residuals beyond 300∘. This trend appears to correspond to the regions of the inner Scutum and Norma Arms. At lower Galactic longitudes (ℓ < ∼50∘), the pattern suggests a peak in the residuals, which may be associated with the near side of the Sagittarius Arm.
Among the presented results, Model A+C3 appears to best reproduce the observed abundance variation across the full range of Galactic longitudes. In both models, the variations are more pronounced in quadrant I than in quadrant IV, aligning with the observational data. However, it is important to note that Model 3 Gyr more accurately accounts for the variations in the observed residuals of both Δ[Mg/H] and Δ[Fe/H] in quadrants I and IV. However, it is worth noting that several wiggle-like features appear in both the Model A+C3 and Model 3 Gyr results. These arise from residual abundance variations computed at different Galactocentric distances across all azimuthal coordinates. Consequently, their projection onto Galactic longitudes leads to the emergence of these patterns. We indeed included all azimuthal coordinates to illustrate the full range of abundance variations induced by the structure of the considered spiral arms.
The abundance variations revealed by Gaia-ESO data appear to support the hypothesis of the transient nature of spiral arms. Slight differences emerge in comparison with Barbillon et al. (2025) analysis. In our study, Model 3 Gyr already represents an extreme case, predicting excessively large variations in quadrants II and III, whereas in Barbillon et al. (2025), 3 Gyr was the minimum value required to reproduce the deficiency in [Ca/Fe] observed in stars within the spiral arms by Gaia GSP-Spec data. This difference may arise from the distinct nucleosynthesis pathways of Mg and Ca, as they do not share the same proportion of production from Type II and Type Ia supernovae.
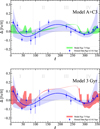 |
Fig. 6 Residuals of [Fe/H] as a function of Galactic longitude (ℓ) for different radial distances in the Milky Way. The plot shows the binned data (blue scatter) fitted with a polynomial (blue line) with a 95% confidence interval. Upper panel: data compared with the Model A+C3 predictions from Spitoni et al. (2023), which assume that, during the last 1 Gyr of disc evolution, all Galactocentric distances are co-rotations. The model is represented by a dashed green area, indicating the range of residual variations computed between 7 and 9 kpc. The residuals are calculated relative to the mean [Fe/H] value in each considered annular regions. Lower panel: same as the upper panel but showing the Model 3 Gyr predictions from Barbillon et al. (2025), where it is assumed that all Galactocentric distances are co-rotations during the last 3 Gyr of evolution. The model is represented by a shaded red area. |
5 Conclusions
We have presented the analysis of the azimuthal distributions of [Fe/H], [Mg/H], and [Mg/Fe] in the Galactic disc, using data from the GES. Such data extend into the innermost regions of the disc, complementing previous works (see e.g. Poggio et al. 2021, 2022; Barbillon et al. 2025) and confirming that, in correspondence with the spiral arms, there is an excess of [Fe/H] and an under-abundance of [Mg/Fe]. Furthermore, we were able to analyse the structure of the arms in the vertical plane, finding a clear decrease in metallicity when moving away from the plane. Our [Mg/H] map reveals a spur connecting the Sagittarius and Scutum arms. Finally, we compared the residual structure in [Fe/H] and [Mg/H] as a function of Galactic longitude with two 2D chemical evolution models (Spitoni et al. 2023; Barbillon et al. 2025). These models incorporate the effect of spiral arms and assume that all radii are co-rotating. Our analysis reveals a strong agreement between our observational results and the model predictions, further evidence of the role played by spiral arm transits in driving both azimuthal and radial variations in chemical abundances.
Acknowledgements
We thank the anonymous referee for her/his useful comments. L.M., C.V.V., E.S., G.C., S.R. and G.G.S. thank INAF for the support (Large Grant EPOCH), the Mini-Grants Checs (1.05.23.04.02), and the financial support under the National Recovery and Resilience Plan (NRRP), Mission 4, Component 2, Investment 1.1, Call for tender No. 104 published on 2.2.2022 by the Italian Ministry of University and Research (MUR), funded by the European Union – NextGenerationEU – Project ‘Cosmic POT’ Grant Assignment Decree No. 2022X4TM3H by the Italian Ministry of the University and Research (MUR). A.V. acknowledges financial support from the European Research Council under the ERC Starting Grant “GalFlow” (grant 101116226). This work made use of SciPy (Virtanen et al. 2020), Astropy (Astropy Collaboration 2018), Seaborn (Waskom 2021), TopCat (Taylor 2005), Pandas (The Pandas development team 2020) and Matplotlib (Hunter 2007). Based on data products from observations made with ESO Telescopes at the La Silla Paranal Observatory under programmes 188.B-3002, 193.B-0936, and 197.B-1074.
References
- Alinder, S., McMillan, P. J., & Bensby, T., 2024, A&A, 690, A15 [NASA ADS] [CrossRef] [EDP Sciences] [Google Scholar]
- Astropy Collaboration (Price-Whelan, A. M., et al.,) 2018, AJ, 156, 123 [Google Scholar]
- Barbillon, M., Recio-Blanco, A., Poggio, E., et al. 2025, A&A, 693, A3 [NASA ADS] [CrossRef] [EDP Sciences] [Google Scholar]
- Bovy, J., 2015, ApJS, 216, 29 [NASA ADS] [CrossRef] [Google Scholar]
- Bressan, A., Marigo, P., Girardi, L., et al. 2012, MNRAS, 427, 127 [NASA ADS] [CrossRef] [Google Scholar]
- Candebat, N., Sacco, G. G., Magrini, L., et al. 2024, A&A, 692, A228 [NASA ADS] [CrossRef] [EDP Sciences] [Google Scholar]
- Castro-Ginard, A., McMillan, P. J., Luri, X., et al. 2021, A&A, 652, A162 [NASA ADS] [CrossRef] [EDP Sciences] [Google Scholar]
- Chieffi, A., & Limongi, M., 2004, ApJ, 608, 405 [NASA ADS] [CrossRef] [Google Scholar]
- Chieffi, A., & Limongi, M., 2013, ApJ, 764, 21 [Google Scholar]
- Dobbs, C. L., & Bonnell, I. A., 2006, MNRAS, 367, 873 [NASA ADS] [CrossRef] [Google Scholar]
- Drimmel, R., Khanna, S., Poggio, E., & Skowron, D. M., 2025, A&A, in press, https://doi.org/10.1051/0004-6361/202451100 [Google Scholar]
- Elmegreen, D. M., 1980, ApJ, 242, 528 [Google Scholar]
- Gaia Collaboration (Brown A. G. A., et al.,) 2021, A&A, 649, A1 [NASA ADS] [CrossRef] [EDP Sciences] [Google Scholar]
- Gaia Collaboration (Vallenari, A., et al.,) 2023, A&A, 674, A1 [NASA ADS] [CrossRef] [EDP Sciences] [Google Scholar]
- Ge, Q. A., Li, J. J., Hao, C. J., et al. 2024, AJ, 168, 25 [NASA ADS] [CrossRef] [Google Scholar]
- Gilmore, G., Randich, S., Worley, C. C., et al. 2022, A&A, 666, A120 [NASA ADS] [CrossRef] [EDP Sciences] [Google Scholar]
- Grand, R. J. J., Kawata, D., & Cropper, M., 2012, MNRAS, 421, 1529 [CrossRef] [Google Scholar]
- Higgins, E. R., Vink, J. S., Hirschi, R., Laird, A. M., & Sabhahit, G. N., 2023, MNRAS, 526, 534 [NASA ADS] [CrossRef] [Google Scholar]
- Hou, L. G., 2021, Front. Astron. Space Sci., 8, 103 [NASA ADS] [CrossRef] [Google Scholar]
- Hourihane, A., François, P., Worley, C. C., et al. 2023, A&A, 676, A129 [NASA ADS] [CrossRef] [EDP Sciences] [Google Scholar]
- Hunt, J. A. S., Bub, M. W., Bovy, J., et al. 2019, MNRAS, 490, 1026 [NASA ADS] [CrossRef] [Google Scholar]
- Hunter, J. D., 2007, Comput. Sci. Eng., 9, 90 [NASA ADS] [CrossRef] [Google Scholar]
- Khoperskov, S., & Gerhard, O., 2022, A&A, 663, A38 [NASA ADS] [CrossRef] [EDP Sciences] [Google Scholar]
- La Vigne, M. A., Vogel, S. N., & Ostriker, E. C., 2006, ApJ, 650, 818 [Google Scholar]
- Lemasle, B., Lala, H. N., Kovtyukh, V., et al. 2022, A&A, 668, A40 [NASA ADS] [CrossRef] [EDP Sciences] [Google Scholar]
- Lépine, J. R. D., Cruz, P., Scarano, Jr. S., et al. 2011, MNRAS, 417, 698 [CrossRef] [Google Scholar]
- Lin, Z., Xu, Y., Hou, L., et al. 2022, ApJ, 931, 72 [NASA ADS] [CrossRef] [Google Scholar]
- Liu, X., He, Z., Luo, Y., & Wang, K., 2025, MNRAS, 537, 2403 [Google Scholar]
- Magrini, L., Viscasillas Vázquez, C., Spina, L., et al. 2023, A&A, 669, A119 [NASA ADS] [CrossRef] [EDP Sciences] [Google Scholar]
- Minchev, I., Famaey, B., Quillen, A. C., et al. 2012, A&A, 548, A126 [NASA ADS] [CrossRef] [EDP Sciences] [Google Scholar]
- Nomoto, K., Kobayashi, C., & Tominaga, N., 2013, ARA&A, 51, 457 [CrossRef] [Google Scholar]
- Palicio, P. A., Recio-Blanco, A., Poggio, E., et al. 2023, A&A, 670, L7 [NASA ADS] [CrossRef] [EDP Sciences] [Google Scholar]
- Poggio, E., Drimmel, R., Cantat-Gaudin, T., et al. 2021, A&A, 651, A104 [NASA ADS] [CrossRef] [EDP Sciences] [Google Scholar]
- Poggio, E., Recio-Blanco, A., Palicio, P. A., et al. 2022, A&A, 666, L4 [NASA ADS] [CrossRef] [EDP Sciences] [Google Scholar]
- Pérez-Villegas, A., Gómez, G. C., & Pichardo, B., 2015, MNRAS, 451, 2922 [CrossRef] [Google Scholar]
- Ramírez, I., Meléndez, J., Bean, J., et al. 2014, A&A, 572, A48 [Google Scholar]
- Randich, S., Gilmore, G., Magrini, L., et al. 2022, A&A, 666, A121 [NASA ADS] [CrossRef] [EDP Sciences] [Google Scholar]
- Recio-Blanco, A., de Laverny, P., Palicio, P. A., et al. 2023, A&A, 674, A29 [NASA ADS] [CrossRef] [EDP Sciences] [Google Scholar]
- Reid, M. J., Menten, K. M., Brunthaler, A., et al. 2019, ApJ, 885, 131 [Google Scholar]
- Rezaei Kh., S., Bailer-Jones, C. A. L., Hogg, D. W., & Schultheis, M., 2018, A&A, 618, A168 [NASA ADS] [CrossRef] [EDP Sciences] [Google Scholar]
- Sánchez-Menguiano, L., Sánchez, S. F., Pérez, I., et al. 2020, MNRAS, 492, 4149 [CrossRef] [Google Scholar]
- Spitoni, E., Cescutti, G., Minchev, I., et al. 2019, A&A, 628, A38 [NASA ADS] [CrossRef] [EDP Sciences] [Google Scholar]
- Spitoni, E., Cescutti, G., Recio-Blanco, A., et al. 2023, A&A, 680, A85 [NASA ADS] [CrossRef] [EDP Sciences] [Google Scholar]
- Tagger, M., Sygnet, J. F., Athanassoula, E., & Pellat, R., 1987, ApJ, 318, L43 [NASA ADS] [CrossRef] [Google Scholar]
- Taylor, M. B., 2005, in Astronomical Data Analysis Software and Systems XIV, eds. P. Shopbell, M. Britton, & R. Ebert, Astronomical Society of the Pacific Conference Series, 347, 29 [NASA ADS] [Google Scholar]
- The Pandas development team 2020, https://doi.org/10.5281/zenodo.3509134 [Google Scholar]
- Vallée, J. P., 2014, AJ, 148, 5 [Google Scholar]
- Vallée, J. P., 2016, AJ, 151, 55 [Google Scholar]
- Van der Swaelmen, M., Viscasillas Vázquez, C., Magrini, L., et al. 2024, A&A, 690, A276 [NASA ADS] [CrossRef] [EDP Sciences] [Google Scholar]
- Vasini, A., Spitoni, E., Matteucci, F., Cescutti, G., & Della Valle, M., 2025, A&A, 693, A37 [NASA ADS] [CrossRef] [EDP Sciences] [Google Scholar]
- Veena, V. S., Schilke, P., Sánchez-Monge, Á., et al. 2021, ApJ, 921, L42 [NASA ADS] [CrossRef] [Google Scholar]
- Virtanen, P., Gommers, R., Oliphant, T. E., et al. 2020, Nat. Methods, 17, 261 [Google Scholar]
- Viscasillas Vázquez, C., Magrini, L., Casali, G., et al. 2022, A&A, 660, A135 [NASA ADS] [CrossRef] [EDP Sciences] [Google Scholar]
- Viscasillas Vázquez, C., Magrini, L., Spina, L., et al. 2023, A&A, 679, A122 [NASA ADS] [CrossRef] [EDP Sciences] [Google Scholar]
- Viscasillas Vázquez, C., Magrini, L., Miret-Roig, N., et al. 2024, A&A, 689, A268 [NASA ADS] [CrossRef] [EDP Sciences] [Google Scholar]
- Vislosky, E., Minchev, I., Khoperskov, S., et al. 2024, MNRAS, 528, 3576 [NASA ADS] [CrossRef] [Google Scholar]
- Waskom, M. L., 2021, J. Open Source Softw., 6, 3021 [CrossRef] [Google Scholar]
- Widmark, A., & Naik, A. P., 2024, A&A, 686, A70 [NASA ADS] [CrossRef] [EDP Sciences] [Google Scholar]
- Xu, Y., Hao, C. J., Liu, D. J., et al. 2023, ApJ, 947, 54 [NASA ADS] [CrossRef] [Google Scholar]
All Figures
|
Fig. 1 Kiel diagram showing the distribution of GE_MW and GE_MW_BL stars in the Teff-log g plane. The background grey-scale density plot represents the full sample of GE_MW and GE_MW_BL stars, with a logarithmic binning. The blue-shaded rectangle highlights the region used to select MSTO stars. The inset shows the distribution of Gaia G magnitudes for the selected stars. In light grey we show grids of PARSEC isochrones (Bressan et al. 2012), with log(age/yr) from 9.0 to 10.0 at solar metallicity. |
| In the text | |
|
Fig. 2 Density plot of approximately ∼5000 MSTO field stars with metallicity [Fe/H] > −0.5. The plot shows the Galactic coordinate system projected onto the XY plane. Lines of constant Galactic longitude (ℓ) and latitude (b) are drawn at regular intervals, while concentric circles represent increasing Galactocentric distances (R). The four Galactic quadrants are also indicated, providing a reference for the spatial distribution of structures within the Milky Way. The colour bar shows the stellar density in physical units of numbers of stars per square parsec (stars/pc2). |
| In the text | |
|
Fig. 3 Gaussian smoothing of the MSTO GES sample in Cartesian XY and XZ planes, colour-coded by metallicity excess. The overlaid spiral arm model follows the framework provided by Drimmel et al. (2024). The spatial distribution of star clusters is also shown, colour-coded by age – young clusters (<0.5 Gyr) as red circles and older clusters (≥0.5 Gyr) as blue triangles – plotted in the XY and XZ planes. |
| In the text | |
|
Fig. 4 Gaussian smoothing of the MSTO GES sample in Cartesian XY and XZ planes, colour-coded by [Mg/Fe] excess. The overlaid spiral arm model follows the framework provided by Drimmel et al. (2024). Black dots represent the subsample of thin discs with ages of less than 5 Gyr. |
| In the text | |
|
Fig. 5 Gaussian smoothing of the MSTO GES sample in Cartesian XY and XZ planes, colour-coded by [Mg/H] excess. The overlaid spiral arm model follows the framework provided by Drimmel et al. (2024). The spatial distribution of star clusters is also shown, colour-coded by age young clusters (<0.5 Gyr) as red circles and older clusters (≥0.5 Gyr) as blue triangles – plotted in the XY and XZ planes. |
| In the text | |
|
Fig. 6 Residuals of [Fe/H] as a function of Galactic longitude (ℓ) for different radial distances in the Milky Way. The plot shows the binned data (blue scatter) fitted with a polynomial (blue line) with a 95% confidence interval. Upper panel: data compared with the Model A+C3 predictions from Spitoni et al. (2023), which assume that, during the last 1 Gyr of disc evolution, all Galactocentric distances are co-rotations. The model is represented by a dashed green area, indicating the range of residual variations computed between 7 and 9 kpc. The residuals are calculated relative to the mean [Fe/H] value in each considered annular regions. Lower panel: same as the upper panel but showing the Model 3 Gyr predictions from Barbillon et al. (2025), where it is assumed that all Galactocentric distances are co-rotations during the last 3 Gyr of evolution. The model is represented by a shaded red area. |
| In the text | |
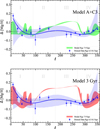 |
Fig. 7 Same as Fig. 6 but for [Mg/H]. |
| In the text | |
Current usage metrics show cumulative count of Article Views (full-text article views including HTML views, PDF and ePub downloads, according to the available data) and Abstracts Views on Vision4Press platform.
Data correspond to usage on the plateform after 2015. The current usage metrics is available 48-96 hours after online publication and is updated daily on week days.
Initial download of the metrics may take a while.