Fig. 2
Download original image
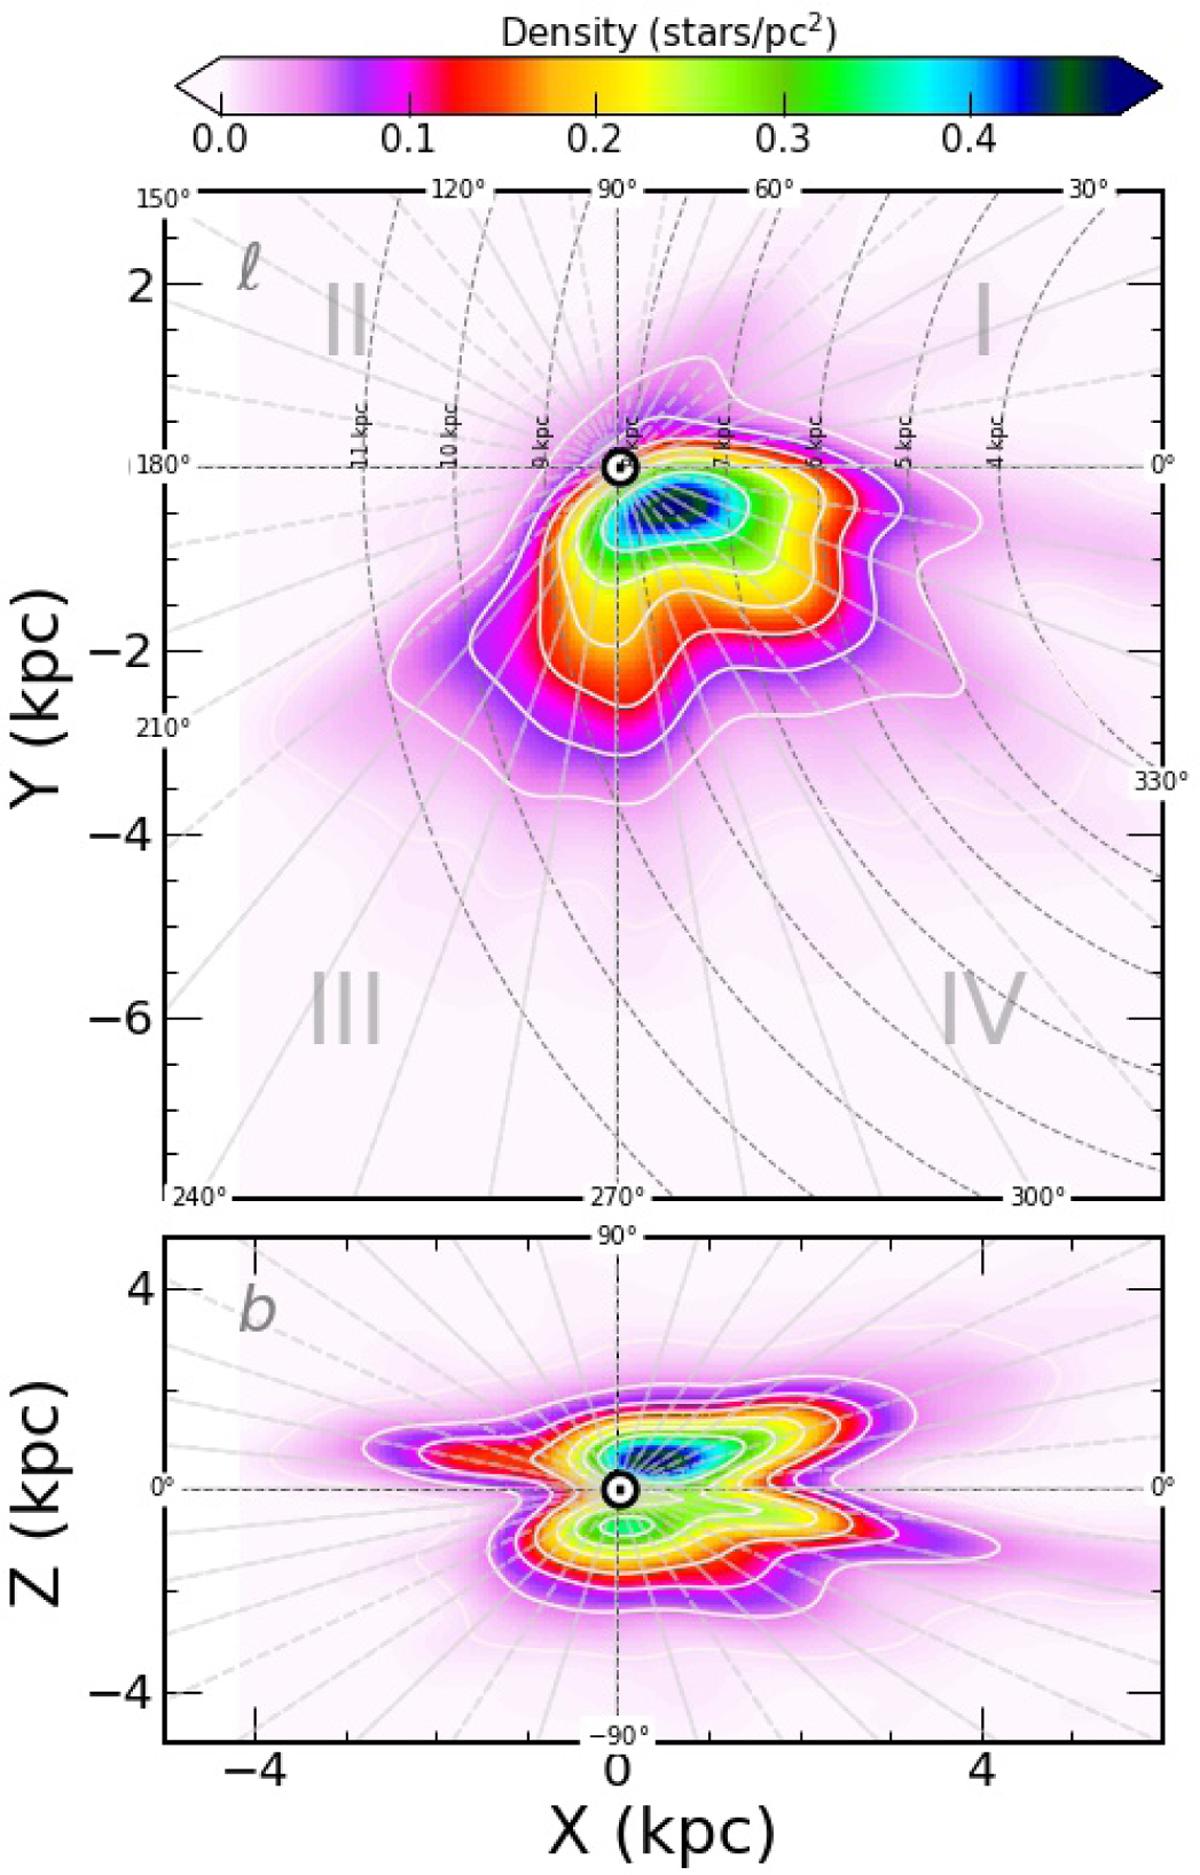
Density plot of approximately ∼5000 MSTO field stars with metallicity [Fe/H] > −0.5. The plot shows the Galactic coordinate system projected onto the XY plane. Lines of constant Galactic longitude (ℓ) and latitude (b) are drawn at regular intervals, while concentric circles represent increasing Galactocentric distances (R). The four Galactic quadrants are also indicated, providing a reference for the spatial distribution of structures within the Milky Way. The colour bar shows the stellar density in physical units of numbers of stars per square parsec (stars/pc2).
Current usage metrics show cumulative count of Article Views (full-text article views including HTML views, PDF and ePub downloads, according to the available data) and Abstracts Views on Vision4Press platform.
Data correspond to usage on the plateform after 2015. The current usage metrics is available 48-96 hours after online publication and is updated daily on week days.
Initial download of the metrics may take a while.