| Issue |
A&A
Volume 698, June 2025
|
|
|---|---|---|
| Article Number | A22 | |
| Number of page(s) | 9 | |
| Section | Astrophysical processes | |
| DOI | https://doi.org/10.1051/0004-6361/202554151 | |
| Published online | 28 May 2025 | |
Exploring polarization and geometry in the X-ray pulsar 4U 1538−52
1
Department of Physics and Astronomy, 20014 University of Turku, Finland
2
Department of Physics, PO Box 64 00014 University of Helsinki, Finland
3
Space Research Institute, Russian Academy of Sciences, Profsoyuznaya 84/32, Moscow 117997, Russia
4
Astrophysics, Department of Physics, University of Oxford, Denys Wilkinson Building, Keble Road, Oxford OX1 3RH, UK
5
INAF Istituto di Astrofisica e Planetologia Spaziali, Via del Fosso del Cavaliere 100, 00133 Roma, Italy
6
University of British Columbia, Vancouver, BC V6T 1Z4, Canada
7
Mullard Space Science Laboratory, University College London, Holmbury St Mary, Dorking, Surrey RH5 6NT, UK
8
MIT Kavli Institute for Astrophysics and Space Research, Massachusetts Institute of Technology, 77 Massachusetts Avenue, Cambridge, MA 02139, USA
9
Dipartimento di Fisica, Università degli Studi di Roma “Tor Vergata”, Via della Ricerca Scientifica 1, 00133 Roma, Italy
10
Department of Physics, McGill University, 3600 Rue University, Montréal, QC H3A 2T8, Canada
11
Trottier Space Institute, McGill University, 3550 Rue University, Montréal, QC H3A 2A7, Canada
12
Institut für Astronomie und Astrophysik, Universität Tübingen, Sand 1, 72076 Tübingen, Germany
⋆ Corresponding author: This email address is being protected from spambots. You need JavaScript enabled to view it.
Received:
16
February
2025
Accepted:
17
April
2025
Abstract
The Imaging X-ray Polarimetry Explorer (IXPE) observations of accreting X-ray pulsars (XRPs) continue to provide novel insights into the physics and geometry of these sources. We present the first X-ray polarimetric study of the persistent wind-fed XRP 4U 1538−52, based on five IXPE observations totaling 360 ks, conducted in March and October 2024. We detect marginally significant polarization in the combined data set in the full 2–8 keV energy band, with a polarization degree (PD) of 3.0 ± 1.1% and polarization angle (PA) of −18° ±11°. The energy-resolved analysis shows a clear energy dependence of the polarization properties, with a remarkable ∼70° switch in PA between low and high energies. Similarly, the pulse phase-resolved spectro-polarimetric analysis reveals different signatures at low and high energies. At low energies (2–3 keV), the PD spans from ∼2% up to ∼18%, accompanied by large-amplitude swings in the PA. At higher energies (4–8 keV), the PD varies between ∼3% and ∼12%, and the PA not only is similarly highly variable but also exhibits a markedly different phase dependence. Fitting the rotating vector model to the pulse phase dependence of the PA at the lower energies, we constrain the geometric configuration of the pulsar. The analysis favors a high spin-axis inclination of > 50°, which agrees with both previous pulse-phase-dependent spectral fitting of the cyclotron line region and the known high orbital inclination of the binary system. The magnetic obliquity is estimated to be 30° and the spin position angle to be 19°. A sharp switch in PA around 3 keV presents a particular theoretical challenge, as it is not consistent with the right-angle switch that was only seen in one other pulsar, Vela X-1.
Key words: magnetic fields / polarization / methods: observational / stars: neutron / X-rays: binaries
© The Authors 2025
 Open Access article, published by EDP Sciences, under the terms of the Creative Commons Attribution License (https://creativecommons.org/licenses/by/4.0), which permits unrestricted use, distribution, and reproduction in any medium, provided the original work is properly cited.
This article is published in open access under the Subscribe to Open model. This email address is being protected from spambots. You need JavaScript enabled to view it. to support open access publication.
1. Introduction
Accreting X-ray pulsars (XRPs) are highly magnetized neutron stars (NSs) in binary systems, where matter is transferred from a massive optical companion via an accretion disk or stellar wind. The presence of a strong magnetic field, typically in the range of 1012 − 1013 G, significantly affects the accretion process, guiding the inflowing plasma along magnetic field lines toward the NS magnetic poles. This results in the formation of compact emission regions of different structure, hot spots or extended accretion columns, depending on the mass accretion rate (see Mushtukov & Tsygankov 2024, for a recent review). These systems have been extensively studied with timing and spectroscopy for the past decades, but the geometric configuration of NSs and host binaries cannot be probed directly using these methods.
With the launch of the Imaging X-ray Polarimetry Explorer (IXPE) in December 2021, X-ray polarimetry in the 2–8 keV band became an indispensable tool to constrain the geometric parameters of XRPs. Within the first three years of its operation, IXPE observed a dozen XRPs: Her X-1 (Doroshenko et al. 2022; Heyl et al. 2024), Cen X-3 (Tsygankov et al. 2022), X Persei (Mushtukov et al. 2023), 4U 1626−67 (Marshall et al. 2022), Vela X-1 (Forsblom et al. 2023), GRO J1008−57 (Tsygankov et al. 2023), EXO 2030+375 (Malacaria et al. 2023), LS V +44 17 (Doroshenko et al. 2023), GX 301−2 (Suleimanov et al. 2023), Swift J0243.6+6124 (Poutanen et al. 2024a), and SMC X-1 (Forsblom et al. 2024). The observed polarization degree (PD) in all these sources turned out to be drastically different from theoretical expectations, which predicted high polarization of up to 60−80% (Meszaros et al. 1988; Harding & Lai 2006; Caiazzo & Heyl 2021). In reality, less than 25% was observed, even in phase-resolved data (for a review see Poutanen et al. 2024b). The observations of low PDs in XRPs have led to new discussions on the physical origin of polarization in these objects. The development of updated models requires expanding the sample of XRPs observed in polarized X-rays and accreting under different conditions.
The binary system 4U 1538−52 (sometimes referred to as 4U 1538−522) is a persistent XRP, in which a NS accretes from the stellar wind of its companion star, a 20 M⊙ B0.2 Ia type supergiant, QV Nor (Clark et al. 1990; Neumann et al. 2023). Initially discovered with a pulsation period of approximately 529 s (Becker et al. 1977; Davison 1977), the pulsar has exhibited long-term spin-up and spin-down trends, which have been documented over the course of several decades (Rubin et al. 1997; Baykal et al. 2006; Malacaria et al. 2020; Tamang et al. 2024). The most recent value of 526.23 s was found using the NuSTAR data (Tamang et al. 2024). The pulse profile shows a simple two-peak structure in soft X-rays with a weak dependence on luminosity (Tamang et al. 2024). Certain progress has been made in constraining the geometrical configuration of the polar caps in 4U 1538−52 using X-ray spectral data from Ginga observations (Bulik et al. 1992). By modeling phase-dependent spectra around the cyclotron line at 20 keV, Bulik et al. (1995) inferred the size, location, and temperature of the polar caps. The analysis indicated significant differences between them, suggesting non-antipodal caps and a complex non-dipole magnetic field structure.
The orbital characteristics of 4U 1538−52 are rather well determined, with a clearly established orbital period Porb of 3.73 d as outlined by Clark (2000). Since then, the orbital period has been very precisely measured with a marginally significant decay at a rate of  yr−1 (Hemphill et al. 2019). Noteworthy, the work of van Kerkwijk et al. (1995) provided estimates on the orbital parameters and the mass function of the system, and unveiled a surprisingly low NS mass of about 1.0 M⊙. Being one of the eclipsing binaries, 4U 1538−52 also has a well-constrained orbital inclination iorb = 67° ±1° (Falanga et al. 2015).
The remainder of this paper is structured as follows. We present the observations and data reduction methods used in the study in Sect. 2. The results, including the pulse profile, spectral and polarimetric analysis are shown in Sect. 3. We discuss the results focusing on the polarization spectrum and pulsar geometry in Sect. 4. Finally, Sect. 5 summarizes the findings and the implications.
2. Observations and data reduction
The IXPE observatory, a NASA mission in partnership with the Italian Space Agency (ASI) (see a detailed description in Weisskopf et al. 2022), has provided X-ray polarimetric data on astrophysical X-ray sources since its launch in December 2021. It is equipped with three polarization-sensitive detector units (DUs; Soffitta et al. 2021; Baldini et al. 2021; Di Marco et al. 2022a), which provide polarimetry in the 2–8 keV energy band and timing with about a 10 μs resolution. 4U 1538−52 was observed by IXPE five separate times during 2024 with a total of 353 ks of effective exposure. The first three observations occurred between March 14 and 25 and the remaining two between October 1 and 5 (see the observation log in Table 1). During the second and third observations, a malfunction in the IXPE data transmission system caused partial corruption of the data. Due to this, only 7 ks of the third observation could be processed. Shortly after the third observation, the source exited the visibility window of IXPE for several months. As a result, the dataset is widely spaced in time and does not cover consecutive orbits. In addition, we utilized data from the Monitor of All-sky X-ray Image (MAXI; Matsuoka et al. 2009). We show the IXPE and MAXI light curves with times of orbital eclipses in Fig. 1.
Observations of 4U 1538−52 by IXPE.
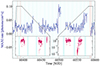 |
Fig. 1. One-day averaged light curve obtained by the MAXI monitor (4–10 keV) during the IXPE observations of the source (dark blue points). The blue-shaded areas correspond to eclipse periods according to Falanga et al. (2015). The red shaded areas represent the IXPE observations with the corresponding count-rate light curves (2–8 keV) shown in zoomed-in panels. |
The data have been processed with the IXPEOBSSIM package version 31.0.3 using the CalDB released on 2024 February 28. Before the data analysis, the position offset correction and energy calibration were applied. Source photons were extracted using a circular region with a radius Rsrc = 80″. Due to the brightness of the source, we did not apply background subtraction and used the unweighted analysis (Di Marco et al. 2022b, 2023).
Event arrival times were corrected to the barycenter of the solar system using the barycorr tool from the FTOOLS package. To account for the effect of binary motion, we corrected the observed event arrival times using the ephemerides from Falanga et al. (2015). The spin period for each observation was searched for separately using Z2 statistics. The results were further refined using phase-connection, by fitting pulse arrival times.
Stokes I spectra have been re-binned to have a minimum of 30 counts per energy channel, with the same binning also applied to the Stokes Q and U spectra. The energy spectra were fitted using the XSPEC package (version 12.14.0) (Arnaud 1996) using χ2 statistics and version 13 instrument response functions (ixpe:obssim20240101:v13 for observations 1–3, and ixpe:obssim20240701:v13 for observations 4–5). The reported uncertainties are given at the 68.3% (1σ) confidence level (c.l.) unless stated otherwise.
3. Results
3.1. Light curve
The X-ray light curve of 4U 1538−52 obtained by MAXI1 is displayed in Fig. 1, with the 2–8 keV light curves obtained with IXPE displayed in the insets. The five IXPE observations are largely consistent with each-other in terms of the count rate. During the fifth observation (ObsID 03010301), a dip was observed following the eclipse. The data from the dip were excluded from all subsequent analysis. The values of the spin period for the five observations are Pspin = 526.26 ± 0.09 s, 526.29 ± 0.09 s, 525.7 ± 1.7 s, 526.21 ± 0.08 s, and 526.22 ± 0.10 s.
3.2. Polarimetric analysis
The polarimetric analysis of 4U 1538−52 was performed using the pcube algorithm from the xpbin tool, which is implemented in the IXPEOBSSIM package according to the formalism by Kislat et al. (2015). We computed the normalized Stokes q = Q/I and u = U/I parameters and the PD using the equation  , and the PA using
  , with the PA measured from north to east counterclockwise on the sky.
The phase-averaged PD and PA in the entire 2–8 keV energy range of IXPE for Obs. 1–5 are given in Table 2 and displayed in the normalized Stokes q and u plane in Fig. 2. Obs. 2 and 3 are combined into a single data set (Obs. 2–3). During Obs. 5 we observed a dip, which we excluded from all subsequent data analysis. We have not detected any significant polarization in the individual observations.
Normalized Stokes parameters q and u, PD, and PA for the phase-averaged data of 4U 1538−52 for Obs. 1–5 using the pcube algorithm.
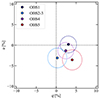 |
Fig. 2. Phase-averaged normalized Stokes q and u parameters for the individual observations in the full 2–8 keV energy range, obtained using the pcube algorithm. The size of the circles correspond to the uncertainty at a 68% c.l. |
Because of the overall similarity between the individual observations of 4U 1538−52, and to achieve increased statistics, we combined the data from all five observations according to the following steps. First, we determined the spin period for each individual observation and created pulse profiles. These pulse profiles were then cross-correlated in order to determine the phase-shifts between the observations, which allowed us to connect phases correctly. Finally, the events of the individual observations were phase-tagged and the data from all five observations combined into a single data set (excluding the dip during Obs. 5). The phase-averaged PD and PA for the combined data set measured in the full 2–8 keV energy band are 3.0 ± 1.1% and −18° ±11°, respectively.
We also studied the energy dependence of the polarization properties by performing an energy-resolved polarimetric analysis dividing the combined data set into 12 energy bins. The results of the energy-resolved analysis are given in Table 3 and displayed in Fig. 3. We see a clear energy dependence of the PA, with an about 70° span of the PA values between low and high energies. A similar energy dependence of the polarization properties was first discovered in Vela X-1 (Forsblom et al. 2023), with a 90° switch in PA between low and high energies. The energy-dependent nature of Vela X-1’s polarization properties was further examined by Forsblom et al. (2025).
Measurements of the normalized Stokes parameters q and u, PD, and PA in different energy bins for the combined data set using the pcube algorithm.
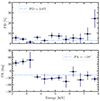 |
Fig. 3. Energy dependence of the PD and PA for the combined set of data (excluding dip), obtained with the pcube algorithm. |
Considering the importance of the PD and PA pulse-phase dependence, we performed a phase-resolved analysis by dividing the data of the combined set into eight uniform phase bins and used the pcube algorithm to determine polarimetric properties in each phase bin. The results in the full 2–8 keV energy range are shown in Fig. 4 (left). Considering the results of the energy-resolved analysis of the combined data set, we followed the analysis methods of Forsblom et al. (2025) and analyze the phase-resolved polarization properties separately for the low (2–3 keV) and high (4–8 keV) energy bands, excluding the 3–4 keV energy range from the analysis in order to minimize the contribution from the adjacent energy band with different PA. The results are displayed in Fig. 4 (right). Normalized Stokes q and u parameters in the 2–8, 2–3, and 4–8 keV energy bands can be found in Table 4.
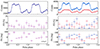 |
Fig. 4. Results of the phase-resolved polarimetric analysis of 4U 1538−52 using the pcube algorithm. Pulse profiles in units of counts per phase bin are displayed in the top panels, while the PD and PA in the central and lower panels. The left panels shows the results in the full IXPE energy range 2–8 keV, while the right panels show the results separately for the low (2–3 keV) and the high (4–8 keV) energy ranges in blue and red, respectively. The error bars correspond to one-sigma uncertainty. |
Spectro-polarimetric parameters in different pulse-phase bins for the combined data set Obs. 1–5 in different energy ranges.
Next, we performed a full phase-averaged spectro-polarimetric analysis of the combined data set, in order to account for the spectral shape and the energy dispersion. Source Stokes I, Q, and U spectra were extracted using the PHA1, PHA1Q, and PHA1U algorithms from the xpbin tool, which produces full data sets of nine spectra, three per DU. Stokes I, Q, and U spectra were produced for each separate observation, and were fitted simultaneously with XSPEC (total number of spectra equal to 45).
The spectral continuum for 4U 1538−52 can be described using a simple absorbed power-law model plus an iron line at ∼6.4 keV. Considering the restrictions imposed by the IXPE energy range and the energy resolution of the instrument (Weisskopf et al. 2022), we did not include the iron line in the final model used for the spectral fitting. We adopted a powerlaw model, with interstellar absorption introduced using the tbabs model with abundances from Wilms et al. (2000). The polconst polarization model, which assumes energy-independent PD and PA, was applied to the spectral continuum. The re-normalization constant, const, was introduced to account for possible discrepancies between the individual DUs, and was fixed to unity for DU1. The final spectral model,

was applied to both the phase-averaged and phase-resolved data. We allowed for the power-law normalization to vary between the individual observations. The initial spectral analysis was performed over the full IXPE energy range of 2–8 keV. Considering the results of the energy-resolved analysis using pcube, we also confined the fit to the low (2–3 keV) and high (4–8 keV) energy bands. The steppar command in XSPEC was used to create confidence contours for both the phase-averaged and phase-resolved analysis. Contour plots at 68.3%, 95.45%, and 99.73% c.l. are shown in Fig. 5 for the phase-averaged results at low (2–3 keV) and high (4–8 keV) energies. The average PA difference between these components is about 70°. Spectral parameters for the best-fit models from the results of the phase-averaged spectro-polarimetric analysis of the combined data set are listed in Table 5.
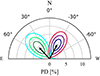 |
Fig. 5. Polarization vectors of 4U 1538−52 from the results of the phase-averaged spectro-polarimetric analysis of the combined data set. Contours at 68.3%, 95.45%, and 99.73% c.l. calculated for two degrees of freedom are shown in shades of blue for 2–3 keV and in shades of red for 4–8 keV. |
Parameters of the best-fit spectro-polarimetric XSPEC model to the phase-averaged combined data set in different energy bands.
A phase-resolved spectro-polarimetric analysis was performed in a similar fashion. The data were separated into eight uniform phase-bins by extracting Stokes I, Q, and U spectra for each individual phase bin using the xpbin tool’s PHA1, PHA1Q, and PHA1U algorithms. The same model was used for the phase-resolved spectral analysis as for the phase-averaged, with the cross-calibration constants for DU2 and DU3 set to the values of the phase-averaged analysis (see Table 5). Similarly to the phase-averaged analysis, we also confined the spectral fitting to the low (2–3 keV) and high (4–8 keV) energy ranges considering the results of the energy-resolved pcube analysis. The results of the phase-resolved spectro-polarimetric analysis for the combined data set in the 2–8, 2–3, and 4–8 keV energy ranges are given in Table 4, with the corresponding contour plots at 68.3%, 95.45%, and 99.73% c.l. shown in Fig. 6 for the low (2–3 keV) and high (4–8 keV) energies.
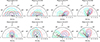 |
Fig. 6. Polarization vectors of 4U 1538−52 from the results of the phase-resolved spectro-polarimetric analysis of the combined data set. Contours at 68.3%, 95.45%, and 99.73% c.l. calculated for two d.o.f. are shown in shades of blue for 2–3 keV and shades of red for 4–8 keV. |
4. Discussion
IXPE observations of accreting XRPs have revealed a multitude of details that challenge the theoretical predictions for these sources made before the IXPE era. 4U 1538−52 exhibits a relatively low PD, consistent with the broader trend across the XRPs detected with IXPE to date. This persistent pattern underscores the necessity for developing new theories that incorporate additional factors influencing polarization properties. More significantly, the unprecedented PA behavior highlights this source as a unique case. So far, the IXPE mission has enabled the geometries of pulsars to be determined for the first time in several systems using the rotating vector model (RVM). We also analyzed the phase-resolved polarization properties of 4U 1538−52 using the RVM, overcoming the challenges posed by the energy-dependent PA.
4.1. Pulsar geometry model
The RVM, as introduced by Radhakrishnan & Cooke (1969) and Meszaros et al. (1988), relates the observed PA of linear polarization to the projection of the pulsar magnetic dipole on the sky. Modeling of the observed pulse phase-dependence of the PA using the RVM has been by now successfully applied to most of the XRPs observed by IXPE. Assuming that radiation is dominated by ordinary mode (O-mode) photons, the PA χ as a function of the rotation phase ϕ is given by Poutanen (2020)
 (1)
(1)
where ϕ0 is the phase when the northern magnetic pole passes in front of the observer, χp is the position angle of the pulsar angular momentum (as the polarization plane of the O-mode is aligned with the magnetic axis at ϕ0), ip is the inclination of the pulsar spin axis to the line of sight, θ is the magnetic obliquity (the angle between the spin and magnetic dipole axes).
We followed the procedure outlined in Suleimanov et al. (2023) and Forsblom et al. (2024) to fit the RVM using Markov chain Monte Carlo simulations. We used the affine-invariant ensemble sampler implemented in the PYTHON pachage EMCEE (Foreman-Mackey et al. 2013) to perform the fitting. Directly fitting these PA values can lead to biases, especially in low signal-to-noise regimes, as the PA is not normally distributed. Instead, we worked with the Stokes parameters in our fitting procedure using the appropriate likelihood function. For polarization data in one pulse phase bin, we used the probability density function of the PA as derived by Naghizadeh-Khouei & Clarke (1993)
![Mathematical equation: $$ \begin{aligned} G(\psi ) = \frac{1}{\sqrt{\pi }} \left\{ \frac{1}{\sqrt{\pi }} + \eta \mathrm{e}^{\eta ^2} \left[1 + \mathrm{erf}(\eta ) \right]\right\} \mathrm{e}^{-p_0^2/2}, \end{aligned} $$](/articles/aa/full_html/2025/06/aa54151-25/aa54151-25-eq12.gif) (2)
(2)
where ![Mathematical equation: $ \eta=p_0 \cos[2(\psi-\psi_0)]/\sqrt{2} $](/articles/aa/full_html/2025/06/aa54151-25/aa54151-25-eq13.gif) , ψ is the model PA,
, ψ is the model PA,  is the measured PA from Stokes parameters, and
  is the measured PD relative to its error, and erf is the error function. The log-likelihood for a set of phase bins is then just the sum of the log-likelihoods over all phase bins
 (3)
(3)
We note that this procedure allows us to use all phase bins, even those where polarization was not detected at a statistically significant level. The probability distribution of the PA is rather flat in these bins and does not affect the obtained RVM parameters.
First, we performed the MCMC fit of the RVM model on the data in the 2–3 keV energy band. We used the values for the normalized Stokes parameters q and u in the eight phase bins given in Table 4. The results of the fitting process and the best-fit model for the PA are shown in Fig. 7. The best-fit parameters are:  deg,
deg,  deg,
deg,  deg, and
  deg. The inclination of the pulsar rotation axis ip and the magnetic obliquity θ derived from the MCMC analysis are compatible with the corresponding values obtained from the cyclotron line region pulse-phase fits performed by Bulik et al. (1992), in some of their models. The high > 50° spin-axis inclination is also consistent with alignment to the binary orbital plane, which is known to be inclined at 67° ±1° (Falanga et al. 2015). Because the 2–3 keV energy band contains only a fraction of the total registered photons, the uncertainties on the constraints from RVM fitting are large.
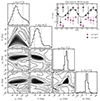 |
Fig. 7. Results of RVM fitting of the pulsar phase-resolved X-ray polarization properties in the 2–3 keV energy band presented in a corner plot. On the upper right panel, the PA data shown with circles and error bars denoting the bin widths and one-sigma errors are plotted against the best-fit RVM model (solid lines). The black color shows the base case fit to only the lower energy band and the magenta shows the higher energy data. |
The 4–8 keV energy band, in turn, contains about two times less photons than the 2–3 keV band. Fitting the RVM model to the high energy band data exclusively provides a rather unreliable fit with very weak constraints:  deg,
deg,  deg,
deg,  deg, and
  deg. The parameter spaces explored by the MCMC simulations for these two energy ranges show largely distinct probability clouds, with minimal overlap in their posterior distributions. We attempted to combine the datasets with a 90° turn in PA for the second dataset, but it became clear that this could not be justified. In fact, we attempted to fit both datasets simultaneously with a single RVM model, where all parameters were shared except for the angle χp. Albeit unphysical, we allowed for an offset Δχp between the χp values of the two datasets, treating this offset as a free parameter. The best-fit value for Δχp was found to be
  degrees, which is the furthest from the right angle. Thus, a single geometric configuration struggles to simultaneously explain the polarization properties across both energy bands. In summary, it is clear that the observed polarization features of the pulse profile cannot be adequately explained by a simple RVM. Possible explanations for the observed behavior are discussed in the next section.
4.2. Energy dependence of the PA
As previously emphasized, the flip in the PA happens at roughly 3 keV. We note, that earlier study of 4U 1538−52 with XMM-Newton presented by Rodes-Roca et al. (2011) shows evidence that a softer spectral component becomes dominant below this energy. Similar spectral dependence of the polarization parameters, including the PA flip between spectral components, has previously been observed for another XRP, namely Vela X-1 (Forsblom et al. 2023). Vela X-1 displays a unique 90° switch in PA between low and high energies, with the change in PA appearing at 3.4 keV. The PD shows a gradual decrease at lower energies, reaching zero at 3.4 keV (corresponding to the 90° PA switch), then gradually increasing at higher energies. The energy dependence of Vela X-1 was examined in more detail in Forsblom et al. (2025), where the pulse-phase dependence of the polarimetric properties similarly was analyzed separately for low and high energies. Two different scenarios were introduced in order to explain the 90° difference between low and high energies: a two-component spectral model and vacuum resonance. 4U 1538−52 and Vela X-1 are very similar systems, with long spin periods, short orbital periods and stellar companions of spectral type B0–0.5 I. Both systems also display a so-called soft excess. Considering the similarities not only between the systems themselves, but also the energy-dependent nature of their polarization properties as discovered by IXPE, it is very likely that the same underlying phenomena is responsible for the energy-dependence.
However, there is a stark difference between 4U 1538−52 and Vela X-1 in terms of the PA switch between the energy bands. In Vela X-1, the PA change strikingly agrees with a 90° shift in both the phase-averaged and phase-resolved analyses. In contrast, 4U 1538−52 shows a phase-averaged PA switch of only about 70°, with the phase-resolved analysis revealing irregular variations, reaching approximately 40° in phase bin 4 (phases 0.375−0.5). A 90° angle could have allowed for a simpler explanation (Forsblom et al. 2025), but the irregular PA switch in 4U 1538−52 is more challenging to interpret.
We also note that both pulsars, 4U 1538−52 and Vela X-1, have been studied for possible pole asymmetry in pulse profile analysis (Bulik et al. 1995). However, the local arrangement of magnetic poles on the pulsar surface could not satisfactorily explain the difference in the PA profile across the IXPE energy range, since the assumption of the RVM is that the PA is determined at the adiabatic radius, where the field structure is dipolar (Heyl & Shaviv 2002; Taverna et al. 2015; Heyl & Caiazzo 2018; Poutanen et al. 2024b). Consequently, an additional polarized component may be responsible for the difference in polarization behavior between the energy bands. A very similar approach has been implemented by Doroshenko et al. (2023) for the Be-transient XRP LS V +44 17 and by Poutanen et al. (2024a) for the ultraluminous XRP Swift J0243+6124, except that in those cases the additional polarized component varied between observations rather than with energy. We show the absolute Stokes parameters in two energy ranges in units of phase-averaged flux of each respective energy band depending on the phase of the pulsar on the Q − U plane in Fig. 8. This shows that the evolution with phase in the two energy bands is drastically different, and the figures the pulsar traces on the Q − U plane are markedly distinct. Thus, even if the difference can be explained by an additional polarized component, this component must depend on the pulsar phase.
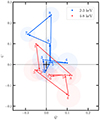 |
Fig. 8. Absolute Stokes parameters in eight phase bins shown for 2–3 keV band (in blue) and 4–8 keV band (in red) normalized by the average flux in each band. The circle sizes correspond to the uncertainties at 68% (1σ) c.l. The data points are annotated with numbers in accordance to Table 4. |
We assume that near a NS, radiation propagates as normal modes with polarization either in the plane containing B-field and photon momentum or perpendicular to it. Within the adiabatic radius, the polarization of photons relative to the local magnetic field direction remains unchanged. Consequently, processes occurring within this region can only produce linear polarization at two PAs differing by 90°. A polarization jump at an angle other than 90° suggests the influence of processes occurring beyond the adiabatic radius. A likely candidate is the scattering of X-ray photons by the magnetospheric accretion flow, which could introduce additional polarization with a PA that varies smoothly with pulse phase. However, at the observed luminosity level, the magnetospheric accretion flow is unlikely to scatter more than 1% of the X-ray photons. Other potential sources of polarized radiation beyond the adiabatic radius include scattering off the stellar wind of the companion (Ahlberg et al. 2024) or accretion disk wind (Doroshenko et al. 2023; Poutanen et al. 2024a; Nitindala et al. 2025), or reflection from the disk itself (Matt 1993; Poutanen et al. 1996). These components of the X-ray flux could also contribute to phase-dependent polarization variations (see discussion in Tsygankov et al. 2022).
5. Summary
4U 1538−52 was observed by IXPE on five separate occasions, three times in March 2024, and twice in October 2024. The results of the first polarimetric study of 4U 1538−52 can be summarized as follows:
-
We do not detect significant polarization in any of the five observations separately in the pulse phase-averaged data. However, we observe similar polarization properties across the individual observations. Combining the data from all observations gives a marginally significant detection of polarization, with PD = 3.0 ± 1.1% and PA = −18° ±11°.
-
The energy-resolved analysis reveals a substantial energy dependence of the polarization properties in 4U 1538−52. The pulse phase-averaged analysis shows a remarkable ∼70° switch in PA between low and high energies, occurring around 3 keV, with indications of drastically different PA behavior with the pulse phase for the lower and higher energy ranges. This kind of energy-dependent polarization is unprecedented in XRPs, having previously been observed only in Vela X-1, where a 90° shift was detected in both phase-averaged and phase-resolved analyses. However, the ∼70° rotation in 4U 1538−52 presents a more significant theoretical challenge.
-
The spectro-polarimetric analysis of the phase-averaged data confirms the energy-dependence, where for the low- and high energy bands we detect significant polarization, with PD = 4.6 ± 1.5% and PA = 42° ±10° in 2–3 keV, and PD = 4.8 ± 1.2% and PA = −28° ±8° in 4–8 keV bands.
-
The pulse phase-resolved polarimetric analysis similarly reveals different behavior of polarization in the low and high energy bands. At low energies (2–3 keV), the PD varies from approximately 2% to 18%, with the PA exhibiting broad swings across the pulse phase. At higher energies (4–8 keV), the PD ranges from around 3% to 12%, while the PA displays a similarly strong variability but with a markedly different and less coherent phase pattern.
-
We are able to determine the geometry of the pulsar by modeling the pulse-phase dependence of the PA using the RVM separately for the low and high energy ranges. For the 2–3 keV energy range, we constrained the pulsar geometry in 4U 1538−52. In particular, the model favors a high > 50° spin-axis inclination, which is consistent with alignment to the binary orbital plane that is also has a high inclination of 67°. The 4–8 keV energy range only provides weak constraints on the pulsar geometry due to lower statistics. The results of the RVM fitting similarly demonstrate the complex nature of energy-dependent polarization properties of 4U 1538−52.
Acknowledgments
The Imaging X-ray Polarimetry Explorer (IXPE) is a joint US and Italian mission. This research used data products provided by the IXPE Team and distributed with additional software tools by the High-Energy Astrophysics Science Archive Research Center (HEASARC), at NASA Goddard Space Flight Center. This research has been supported by the Vilho, Yrjö, and Kalle Väisälä foundation (SVF), the Ministry of Science and Higher Education grant 075-15-2024-647 (SST, JP), the EDUFI Fellowship and Jenny and Antti Wihuri Foundation (AS), and the UKRI Stephen Hawking fellowship (AAM). ADM and FLM are supported by the Italian Space Agency (Agenzia Spaziale Italiana, ASI) through contract ASI-INAF-2022-19-HH.0, by the Istituto Nazionale di Astrofisica (INAF) in Italy, and by MAECI with grant CN24GR08 “GRBAXP: Guangxi-Rome Bilateral Agreement for X-ray Polarimetry in Astrophysics”. RMEK acknowledges funding from UKRI Science and Technology Facilities Council (STFC) for a PhD studentship (ST/W507891/1), an STFC Long Term Attachment fund, MIT and Dr Herman L. Marshall for travel bursary support (supported in part by MIT Corporate Relations and its Industrial Liaison Program). MN is a Fonds de Recherche du Quebec – Nature et Technologies (FRQNT) postdoctoral fellow. VFS thanks Deutsche Forschungsgemeinschaft (DFG) grant WE 1312/59-1 for support.
References
- Ahlberg, V., Kravtsov, V., & Poutanen, J. 2024, A&A, 688, A220 [NASA ADS] [CrossRef] [EDP Sciences] [Google Scholar]
- Arnaud, K. A. 1996, ASP Conf. Ser., 101, 17 [Google Scholar]
- Bailer-Jones, C. A. L., Rybizki, J., Fouesneau, M., Demleitner, M., & Andrae, R. 2021, AJ, 161, 147 [Google Scholar]
- Baldini, L., Barbanera, M., Bellazzini, R., et al. 2021, Astropart. Phys., 133, 102628 [NASA ADS] [CrossRef] [Google Scholar]
- Baykal, A., Inam, S. Ç., & Beklen, E. 2006, A&A, 453, 1037 [NASA ADS] [CrossRef] [EDP Sciences] [Google Scholar]
- Becker, R. H., Swank, J. H., Boldt, E. A., et al. 1977, ApJ, 216, L11 [Google Scholar]
- Bulik, T., Meszaros, P., Woo, J. W., Hagase, F., & Makishima, K. 1992, ApJ, 395, 564 [Google Scholar]
- Bulik, T., Riffert, H., Meszaros, P., et al. 1995, ApJ, 444, 405 [NASA ADS] [CrossRef] [Google Scholar]
- Caiazzo, I., & Heyl, J. 2021, MNRAS, 501, 109 [Google Scholar]
- Clark, G. W. 2000, ApJ, 542, L131 [Google Scholar]
- Clark, G. W., Woo, J. W., Nagase, F., Makishima, K., & Sakao, T. 1990, ApJ, 353, 274 [Google Scholar]
- Davison, P. J. N. 1977, MNRAS, 179, 35P [Google Scholar]
- Di Marco, A., Fabiani, S., La Monaca, F., et al. 2022a, AJ, 164, 103 [NASA ADS] [CrossRef] [Google Scholar]
- Di Marco, A., Costa, E., Muleri, F., et al. 2022b, AJ, 163, 170 [NASA ADS] [CrossRef] [Google Scholar]
- Di Marco, A., Soffitta, P., Costa, E., et al. 2023, AJ, 165, 143 [CrossRef] [Google Scholar]
- Doroshenko, V., Poutanen, J., Tsygankov, S. S., et al. 2022, Nat. Astron., 6, 1433 [NASA ADS] [CrossRef] [Google Scholar]
- Doroshenko, V., Poutanen, J., Heyl, J., et al. 2023, A&A, 677, A57 [NASA ADS] [CrossRef] [EDP Sciences] [Google Scholar]
- Falanga, M., Bozzo, E., Lutovinov, A., et al. 2015, A&A, 577, A130 [NASA ADS] [CrossRef] [EDP Sciences] [Google Scholar]
- Foreman-Mackey, D., Hogg, D. W., Lang, D., & Goodman, J. 2013, PASP, 125, 306 [Google Scholar]
- Forsblom, S. V., Poutanen, J., Tsygankov, S. S., et al. 2023, ApJ, 947, L20 [NASA ADS] [CrossRef] [Google Scholar]
- Forsblom, S. V., Tsygankov, S. S., Poutanen, J., et al. 2024, A&A, 691, A216 [NASA ADS] [CrossRef] [EDP Sciences] [Google Scholar]
- Forsblom, S. V., Tsygankov, S. S., Suleimanov, V. F., Mushtukov, A. A., & Poutanen, J. 2025, A&A, 696, A224 [NASA ADS] [CrossRef] [EDP Sciences] [Google Scholar]
- Harding, A. K., & Lai, D. 2006, Rep. Progr. Phys., 69, 2631 [CrossRef] [Google Scholar]
- Hemphill, P. B., Rothschild, R. E., Cheatham, D. M., et al. 2019, ApJ, 873, 62 [NASA ADS] [CrossRef] [Google Scholar]
- Heyl, J., & Caiazzo, I. 2018, Galaxies, 6, 76 [NASA ADS] [CrossRef] [Google Scholar]
- Heyl, J. S., & Shaviv, N. J. 2002, Phys. Rev. D, 66, 023002 [NASA ADS] [CrossRef] [Google Scholar]
- Heyl, J., Doroshenko, V., González-Caniulef, D., et al. 2024, Nat. Astron., 8, 1047 [NASA ADS] [CrossRef] [Google Scholar]
- Kislat, F., Clark, B., Beilicke, M., & Krawczynski, H. 2015, Astropart. Phys., 68, 45 [NASA ADS] [CrossRef] [Google Scholar]
- Malacaria, C., Jenke, P., Roberts, O. J., et al. 2020, ApJ, 896, 90 [NASA ADS] [CrossRef] [Google Scholar]
- Malacaria, C., Heyl, J., Doroshenko, V., et al. 2023, A&A, 675, A29 [NASA ADS] [CrossRef] [EDP Sciences] [Google Scholar]
- Marshall, H. L., Ng, M., Rogantini, D., et al. 2022, ApJ, 940, 70 [NASA ADS] [CrossRef] [Google Scholar]
- Matsuoka, M., Kawasaki, K., Ueno, S., et al. 2009, PASJ, 61, 999 [Google Scholar]
- Matt, G. 1993, MNRAS, 260, 663 [NASA ADS] [CrossRef] [Google Scholar]
- Meszaros, P., Novick, R., Szentgyorgyi, A., Chanan, G. A., & Weisskopf, M. C. 1988, ApJ, 324, 1056 [NASA ADS] [CrossRef] [Google Scholar]
- Mushtukov, A., & Tsygankov, S. 2024, Handbook of X-ray and Gamma-ray Astrophysics (Singapore: Springer), 4105 [Google Scholar]
- Mushtukov, A. A., Tsygankov, S. S., Poutanen, J., et al. 2023, MNRAS, 524, 2004 [NASA ADS] [CrossRef] [Google Scholar]
- Naghizadeh-Khouei, J., & Clarke, D. 1993, A&A, 274, 968 [NASA ADS] [Google Scholar]
- Neumann, M., Avakyan, A., Doroshenko, V., & Santangelo, A. 2023, A&A, 677, A134 [NASA ADS] [CrossRef] [EDP Sciences] [Google Scholar]
- Nitindala, A. P., Veledina, A., & Poutanen, J. 2025, A&A, 694, A230 [NASA ADS] [CrossRef] [EDP Sciences] [Google Scholar]
- Poutanen, J. 2020, A&A, 641, A166 [NASA ADS] [CrossRef] [EDP Sciences] [Google Scholar]
- Poutanen, J., Nagendra, K. N., & Svensson, R. 1996, MNRAS, 283, 892 [NASA ADS] [CrossRef] [Google Scholar]
- Poutanen, J., Tsygankov, S. S., Doroshenko, V., et al. 2024a, A&A, 691, A123 [NASA ADS] [CrossRef] [EDP Sciences] [Google Scholar]
- Poutanen, J., Tsygankov, S. S., & Forsblom, S. V. 2024b, Galaxies, 12, 46 [NASA ADS] [CrossRef] [Google Scholar]
- Radhakrishnan, V., & Cooke, D. J. 1969, Astrophys. Lett., 3, 225 [NASA ADS] [Google Scholar]
- Rodes-Roca, J. J., Page, K. L., Torrejón, J. M., Osborne, J. P., & Bernabéu, G. 2011, A&A, 526, A64 [NASA ADS] [CrossRef] [EDP Sciences] [Google Scholar]
- Rubin, B. C., Finger, M. H., Scott, D. M., & Wilson, R. B. 1997, ApJ, 488, 413 [Google Scholar]
- Soffitta, P., Baldini, L., Bellazzini, R., et al. 2021, AJ, 162, 208 [CrossRef] [Google Scholar]
- Suleimanov, V. F., Forsblom, S. V., Tsygankov, S. S., et al. 2023, A&A, 678, A119 [NASA ADS] [CrossRef] [EDP Sciences] [Google Scholar]
- Tamang, R., Ghising, M., Tobrej, M., Rai, B., & Paul, B. C. 2024, MNRAS, 527, 3164 [Google Scholar]
- Taverna, R., Turolla, R., Gonzalez Caniulef, D., et al. 2015, MNRAS, 454, 3254 [NASA ADS] [CrossRef] [Google Scholar]
- Tsygankov, S. S., Doroshenko, V., Poutanen, J., et al. 2022, ApJ, 941, L14 [NASA ADS] [CrossRef] [Google Scholar]
- Tsygankov, S. S., Doroshenko, V., Mushtukov, A. A., et al. 2023, A&A, 675, A48 [NASA ADS] [CrossRef] [EDP Sciences] [Google Scholar]
- van Kerkwijk, M. H., van Paradijs, J., & Zuiderwijk, E. J. 1995, A&A, 303, 497 [NASA ADS] [Google Scholar]
- Weisskopf, M. C., Soffitta, P., Baldini, L., et al. 2022, JATIS, 8, 026002 [NASA ADS] [Google Scholar]
- Wilms, J., Allen, A., & McCray, R. 2000, ApJ, 542, 914 [Google Scholar]
All Tables
Normalized Stokes parameters q and u, PD, and PA for the phase-averaged data of 4U 1538−52 for Obs. 1–5 using the pcube algorithm.
Measurements of the normalized Stokes parameters q and u, PD, and PA in different energy bins for the combined data set using the pcube algorithm.
Spectro-polarimetric parameters in different pulse-phase bins for the combined data set Obs. 1–5 in different energy ranges.
Parameters of the best-fit spectro-polarimetric XSPEC model to the phase-averaged combined data set in different energy bands.
All Figures
|
Fig. 1. One-day averaged light curve obtained by the MAXI monitor (4–10 keV) during the IXPE observations of the source (dark blue points). The blue-shaded areas correspond to eclipse periods according to Falanga et al. (2015). The red shaded areas represent the IXPE observations with the corresponding count-rate light curves (2–8 keV) shown in zoomed-in panels. |
| In the text | |
|
Fig. 2. Phase-averaged normalized Stokes q and u parameters for the individual observations in the full 2–8 keV energy range, obtained using the pcube algorithm. The size of the circles correspond to the uncertainty at a 68% c.l. |
| In the text | |
|
Fig. 3. Energy dependence of the PD and PA for the combined set of data (excluding dip), obtained with the pcube algorithm. |
| In the text | |
|
Fig. 4. Results of the phase-resolved polarimetric analysis of 4U 1538−52 using the pcube algorithm. Pulse profiles in units of counts per phase bin are displayed in the top panels, while the PD and PA in the central and lower panels. The left panels shows the results in the full IXPE energy range 2–8 keV, while the right panels show the results separately for the low (2–3 keV) and the high (4–8 keV) energy ranges in blue and red, respectively. The error bars correspond to one-sigma uncertainty. |
| In the text | |
|
Fig. 5. Polarization vectors of 4U 1538−52 from the results of the phase-averaged spectro-polarimetric analysis of the combined data set. Contours at 68.3%, 95.45%, and 99.73% c.l. calculated for two degrees of freedom are shown in shades of blue for 2–3 keV and in shades of red for 4–8 keV. |
| In the text | |
|
Fig. 6. Polarization vectors of 4U 1538−52 from the results of the phase-resolved spectro-polarimetric analysis of the combined data set. Contours at 68.3%, 95.45%, and 99.73% c.l. calculated for two d.o.f. are shown in shades of blue for 2–3 keV and shades of red for 4–8 keV. |
| In the text | |
|
Fig. 7. Results of RVM fitting of the pulsar phase-resolved X-ray polarization properties in the 2–3 keV energy band presented in a corner plot. On the upper right panel, the PA data shown with circles and error bars denoting the bin widths and one-sigma errors are plotted against the best-fit RVM model (solid lines). The black color shows the base case fit to only the lower energy band and the magenta shows the higher energy data. |
| In the text | |
|
Fig. 8. Absolute Stokes parameters in eight phase bins shown for 2–3 keV band (in blue) and 4–8 keV band (in red) normalized by the average flux in each band. The circle sizes correspond to the uncertainties at 68% (1σ) c.l. The data points are annotated with numbers in accordance to Table 4. |
| In the text | |
Current usage metrics show cumulative count of Article Views (full-text article views including HTML views, PDF and ePub downloads, according to the available data) and Abstracts Views on Vision4Press platform.
Data correspond to usage on the plateform after 2015. The current usage metrics is available 48-96 hours after online publication and is updated daily on week days.
Initial download of the metrics may take a while.