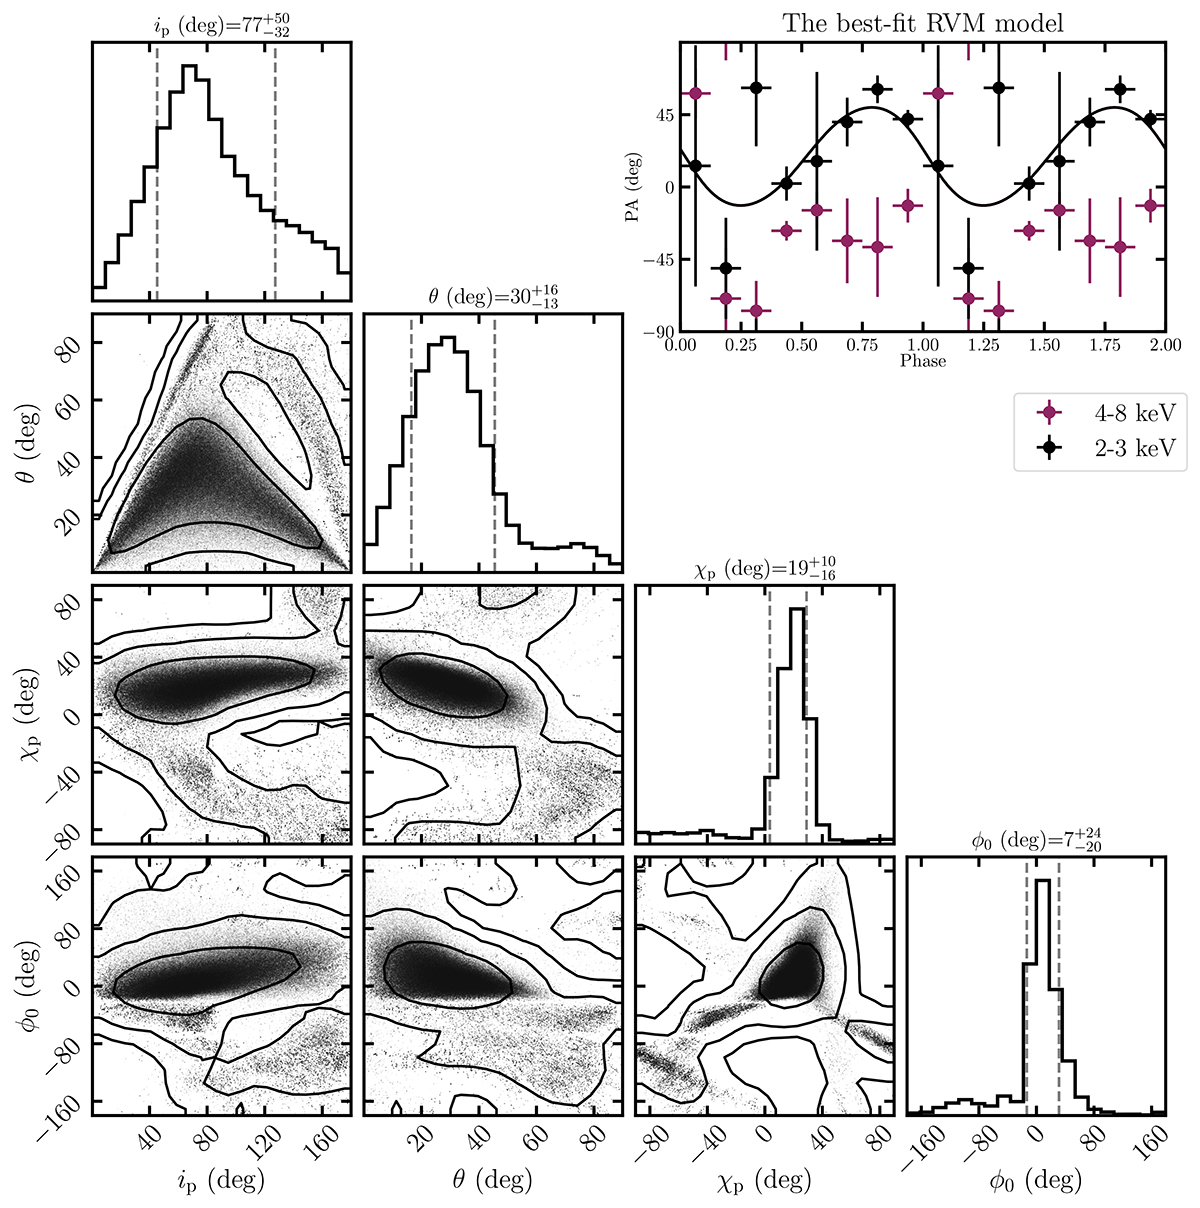
Fig. 7.
Download original image
Results of RVM fitting of the pulsar phase-resolved X-ray polarization properties in the 2–3 keV energy band presented in a corner plot. On the upper right panel, the PA data shown with circles and error bars denoting the bin widths and one-sigma errors are plotted against the best-fit RVM model (solid lines). The black color shows the base case fit to only the lower energy band and the magenta shows the higher energy data.
Current usage metrics show cumulative count of Article Views (full-text article views including HTML views, PDF and ePub downloads, according to the available data) and Abstracts Views on Vision4Press platform.
Data correspond to usage on the plateform after 2015. The current usage metrics is available 48-96 hours after online publication and is updated daily on week days.
Initial download of the metrics may take a while.