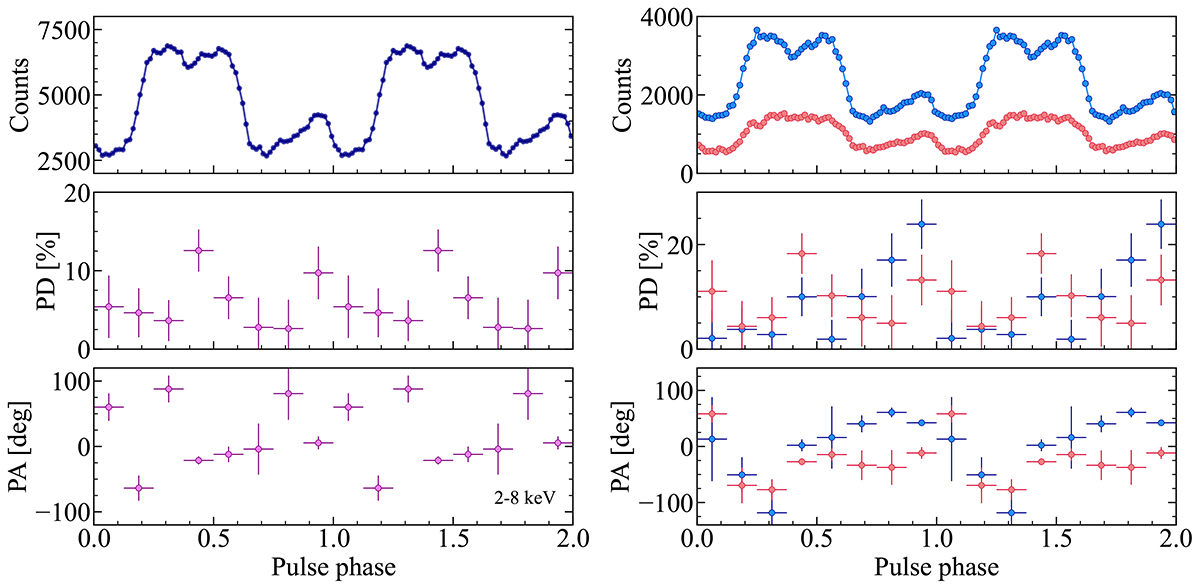
Fig. 4.
Download original image
Results of the phase-resolved polarimetric analysis of 4U 1538−52 using the pcube algorithm. Pulse profiles in units of counts per phase bin are displayed in the top panels, while the PD and PA in the central and lower panels. The left panels shows the results in the full IXPE energy range 2–8 keV, while the right panels show the results separately for the low (2–3 keV) and the high (4–8 keV) energy ranges in blue and red, respectively. The error bars correspond to one-sigma uncertainty.
Current usage metrics show cumulative count of Article Views (full-text article views including HTML views, PDF and ePub downloads, according to the available data) and Abstracts Views on Vision4Press platform.
Data correspond to usage on the plateform after 2015. The current usage metrics is available 48-96 hours after online publication and is updated daily on week days.
Initial download of the metrics may take a while.