Fig. 1.
Download original image
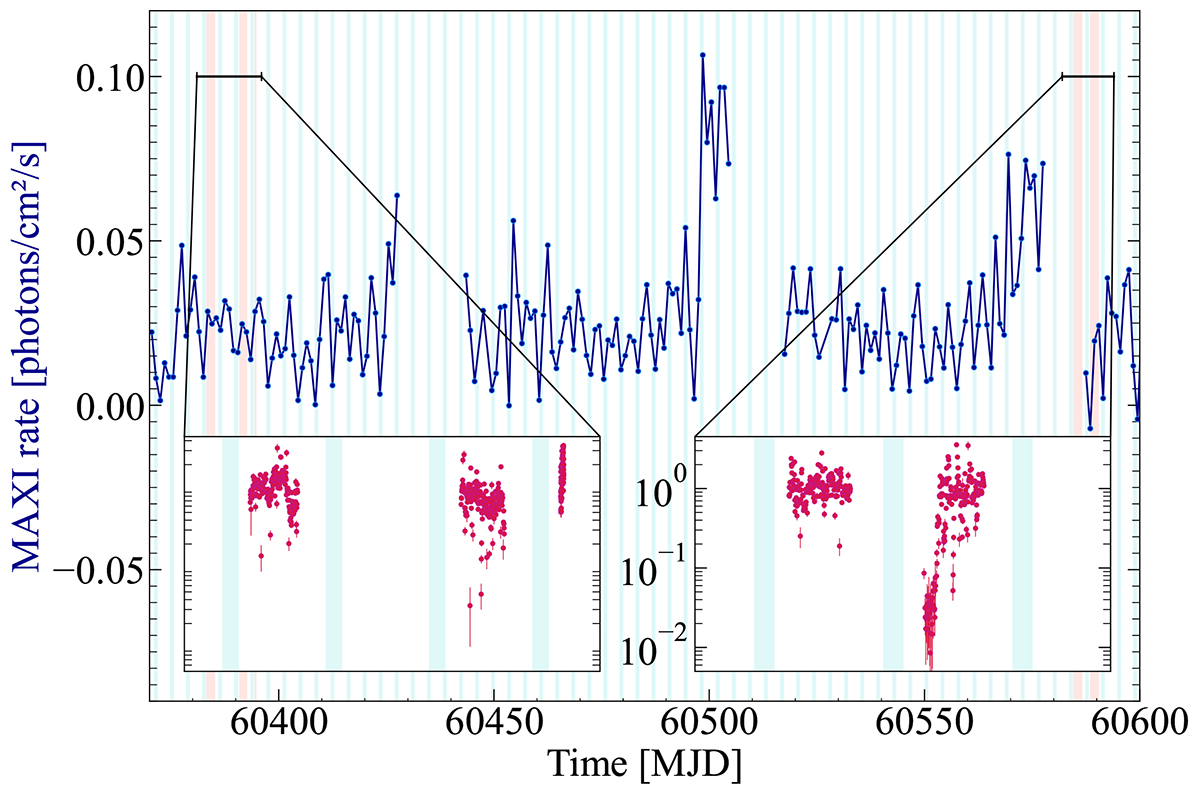
One-day averaged light curve obtained by the MAXI monitor (4–10 keV) during the IXPE observations of the source (dark blue points). The blue-shaded areas correspond to eclipse periods according to Falanga et al. (2015). The red shaded areas represent the IXPE observations with the corresponding count-rate light curves (2–8 keV) shown in zoomed-in panels.
Current usage metrics show cumulative count of Article Views (full-text article views including HTML views, PDF and ePub downloads, according to the available data) and Abstracts Views on Vision4Press platform.
Data correspond to usage on the plateform after 2015. The current usage metrics is available 48-96 hours after online publication and is updated daily on week days.
Initial download of the metrics may take a while.