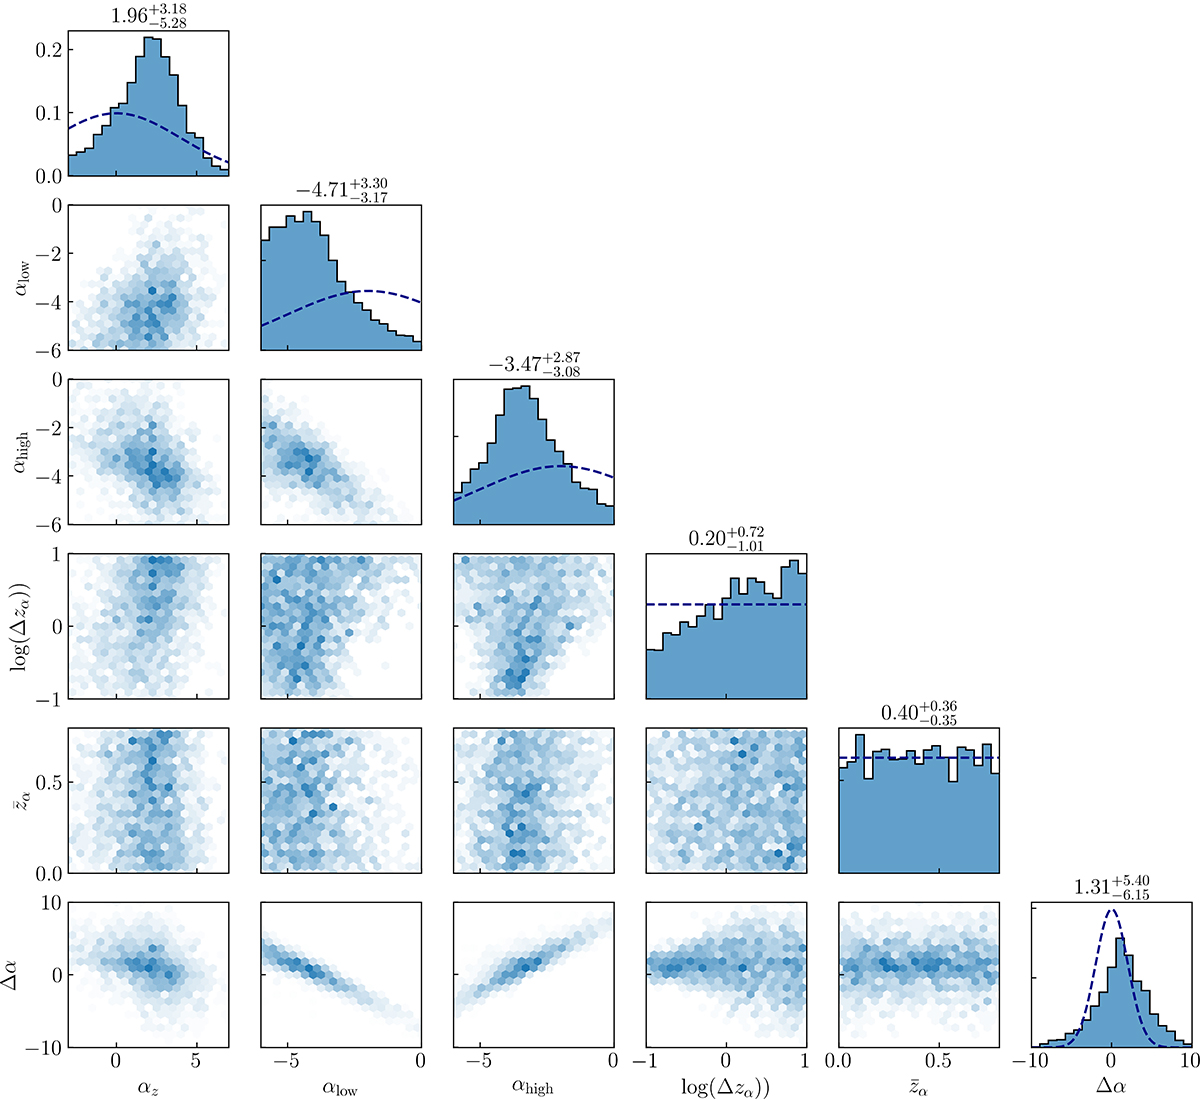
Fig. C.3.
Download original image
Posteriors of the hyperparameters related to the variation in α in redshift are shown. The dark blue dashed lines in the one-dimensional distributions represent the priors. The hyperparameters shown here are the (ascending) power-law index αz of the modeled merger rate, and then hyperparameters connected to varying α from Eq. (2). This includes αlow, αhigh, the width of the sigmoid log(Δzα) and the middle of the sigmoid ![]() . We also plot the difference between the high-redshift and low-redshift value Δα, which now is a Gaussian, because the difference of two Gaussians is once again a Gaussian distribution variable.
. We also plot the difference between the high-redshift and low-redshift value Δα, which now is a Gaussian, because the difference of two Gaussians is once again a Gaussian distribution variable.
Current usage metrics show cumulative count of Article Views (full-text article views including HTML views, PDF and ePub downloads, according to the available data) and Abstracts Views on Vision4Press platform.
Data correspond to usage on the plateform after 2015. The current usage metrics is available 48-96 hours after online publication and is updated daily on week days.
Initial download of the metrics may take a while.