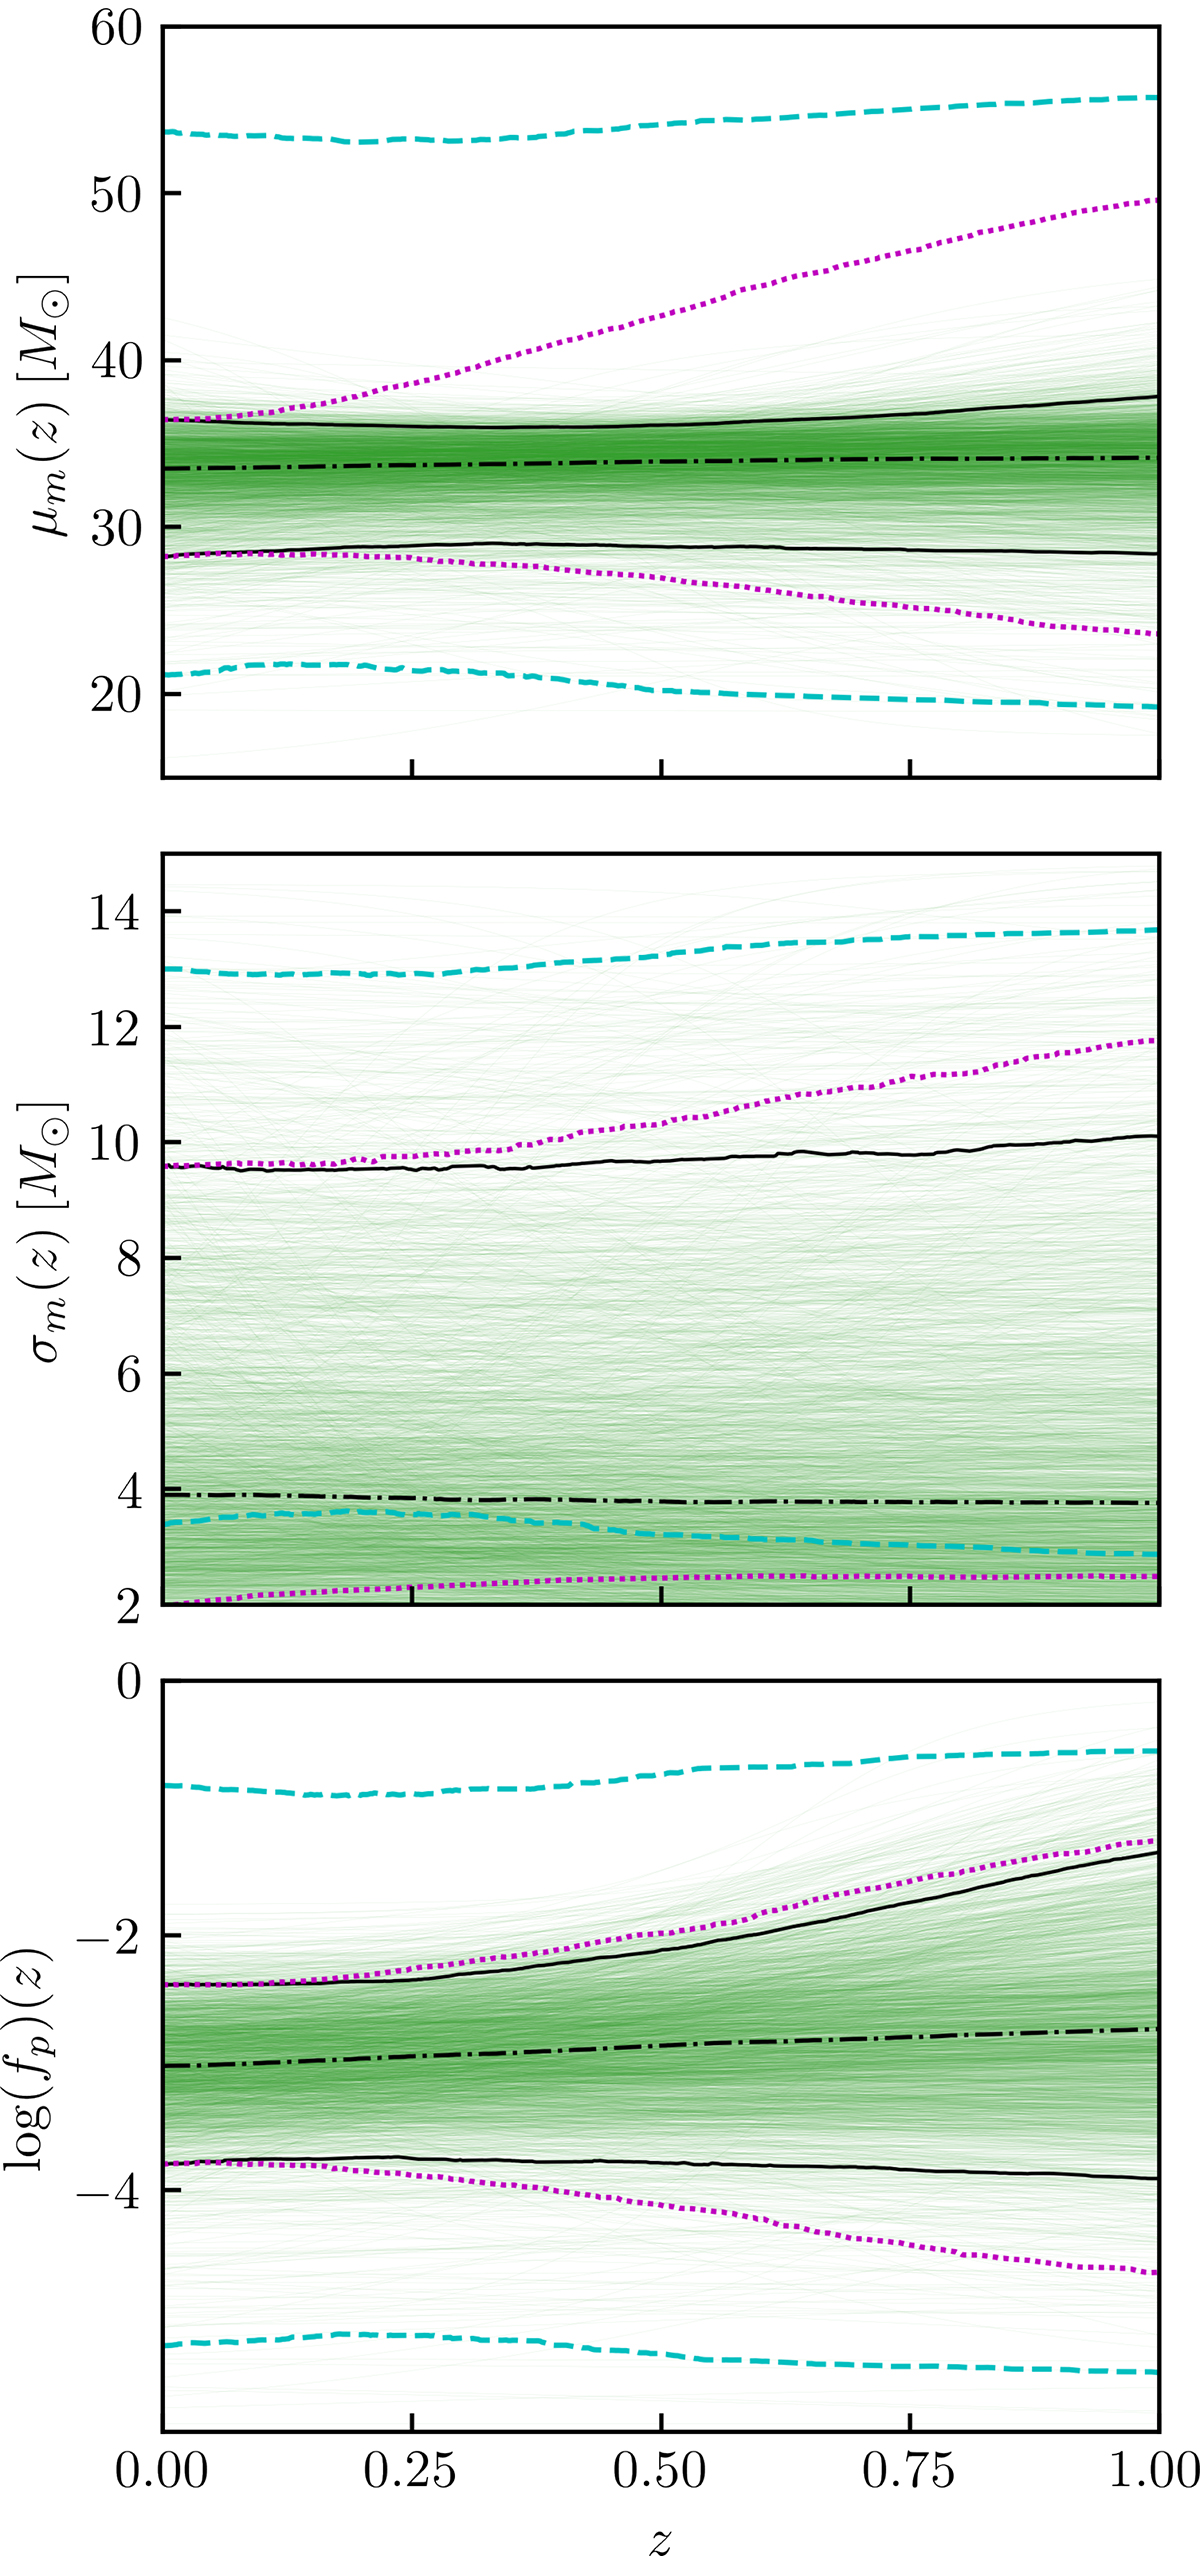
Fig. 3.
Download original image
Inferred values of the hyperparameters characterizing the mean (top), standard deviation (middle), and height (bottom) of the Gaussian peak in the black hole mass spectrum as a function of redshift. In each panel, the green traces mark individual hyperposterior samples, and the solid and dot-dashed black curves indicate 95% credible posterior bounds and medians, respectively. The dashed cyan lines analogously illustrate 95% credible prior bounds. Finally, the dotted magenta curves indicate 95% credible prior bounds on each parameter when it is first conditioned on the measured posteriors at z = 0.
Current usage metrics show cumulative count of Article Views (full-text article views including HTML views, PDF and ePub downloads, according to the available data) and Abstracts Views on Vision4Press platform.
Data correspond to usage on the plateform after 2015. The current usage metrics is available 48-96 hours after online publication and is updated daily on week days.
Initial download of the metrics may take a while.