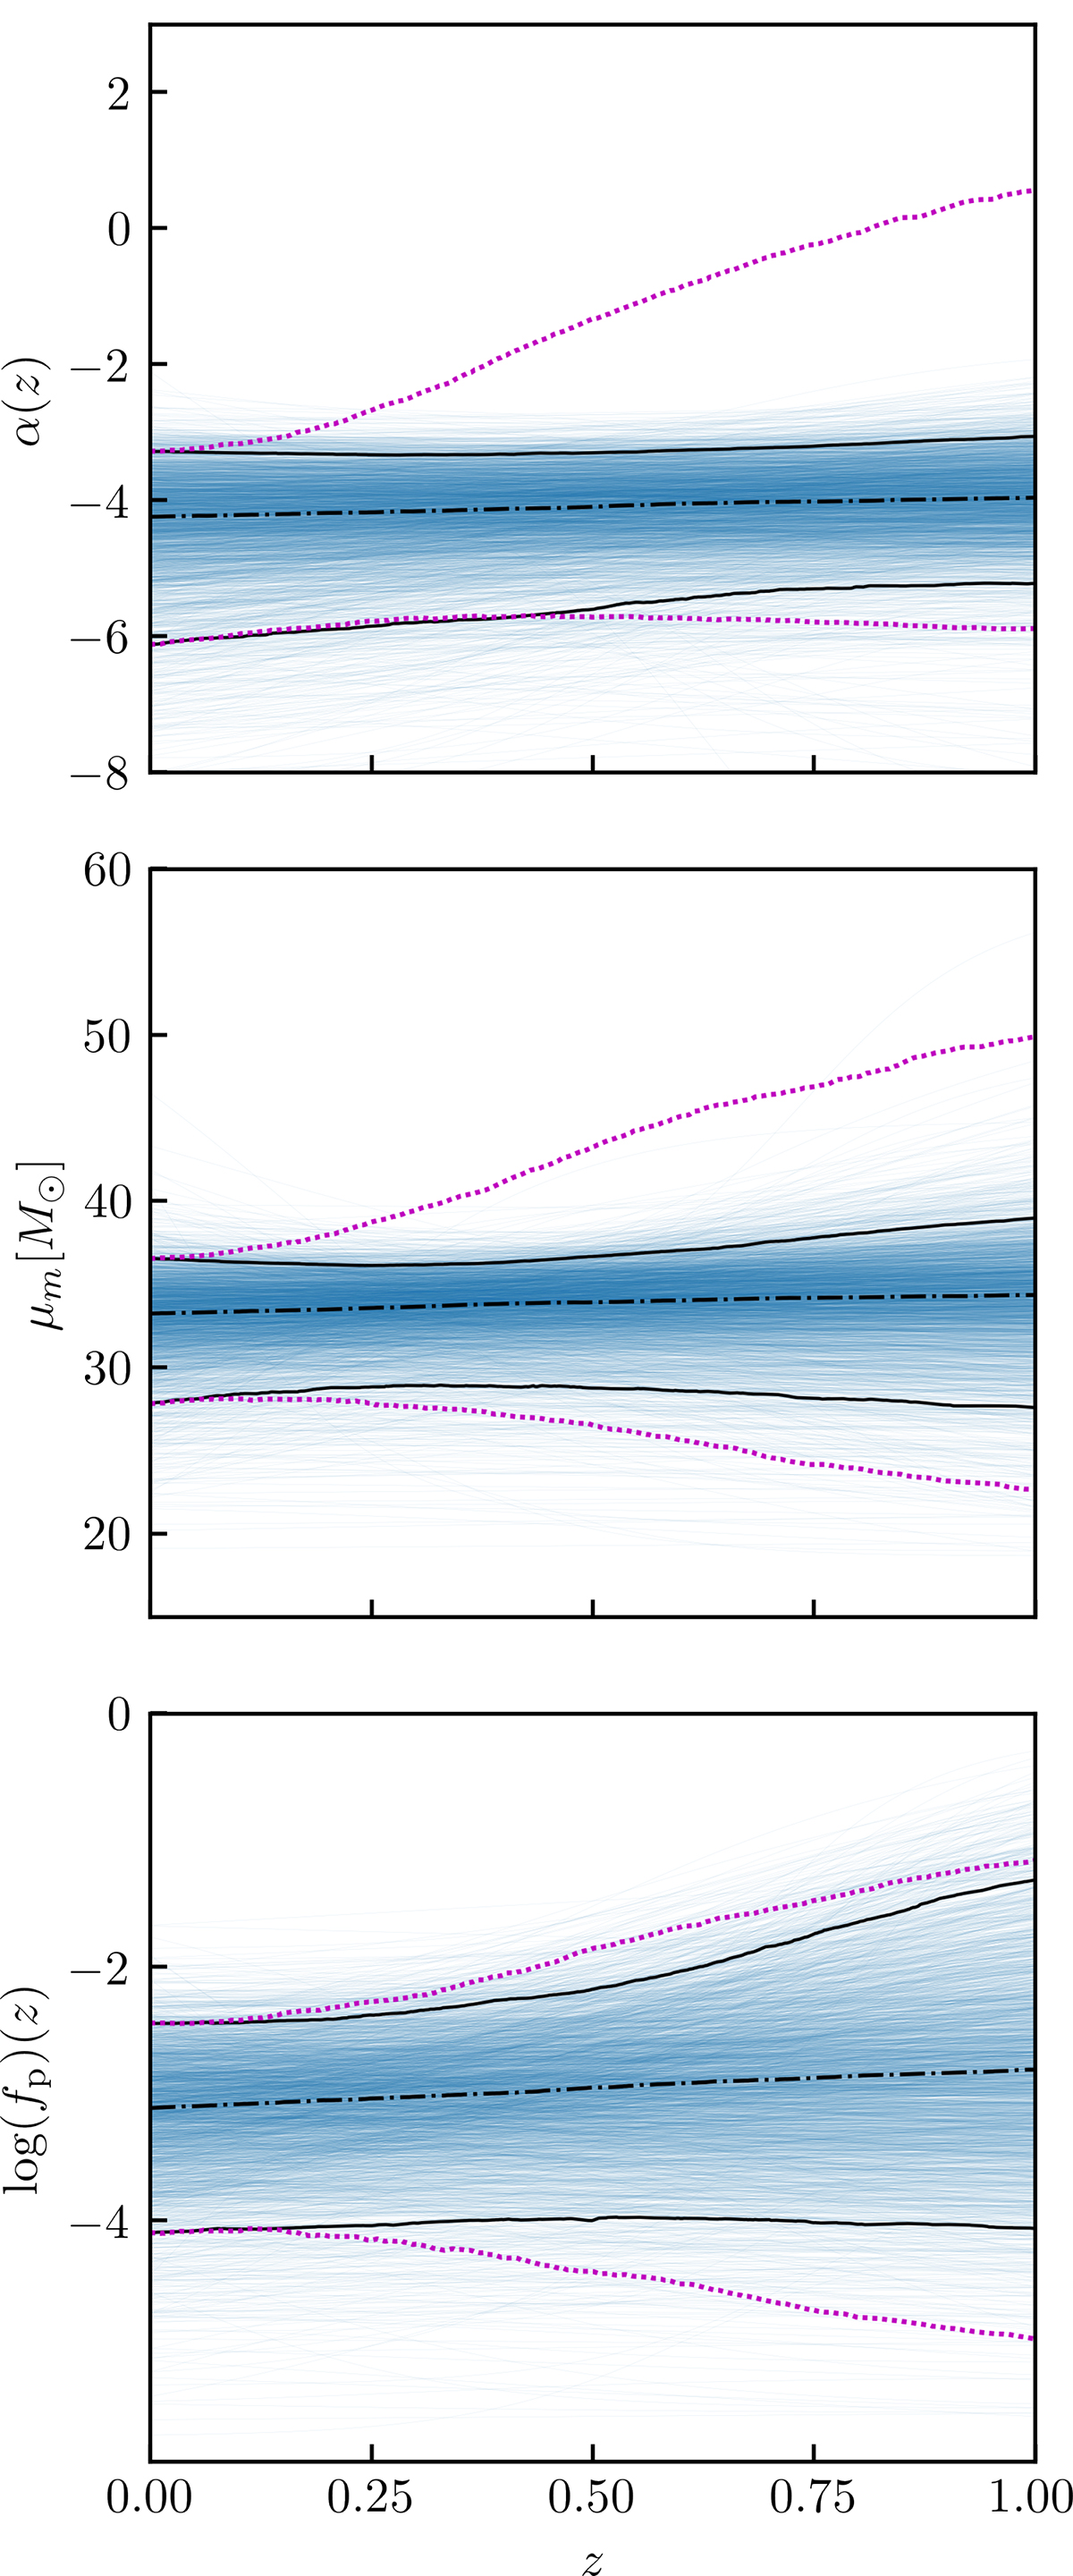
Fig. D.1.
Download original image
The traces of three hyperparameters from the all-varying analysis, where the blue lines are the sample traces, the dot-dashed black line is the median value of the traces, the solid black lines are the 95% confidence intervals and the magenta dotted lines are the conditional priors. The top panel shows the power-law continuum index α, the middle panel the location of the Gaussian excess μm and the bottom panel shows the fraction of events in the peak log fp.
Current usage metrics show cumulative count of Article Views (full-text article views including HTML views, PDF and ePub downloads, according to the available data) and Abstracts Views on Vision4Press platform.
Data correspond to usage on the plateform after 2015. The current usage metrics is available 48-96 hours after online publication and is updated daily on week days.
Initial download of the metrics may take a while.