Fig. C.5.
Download original image
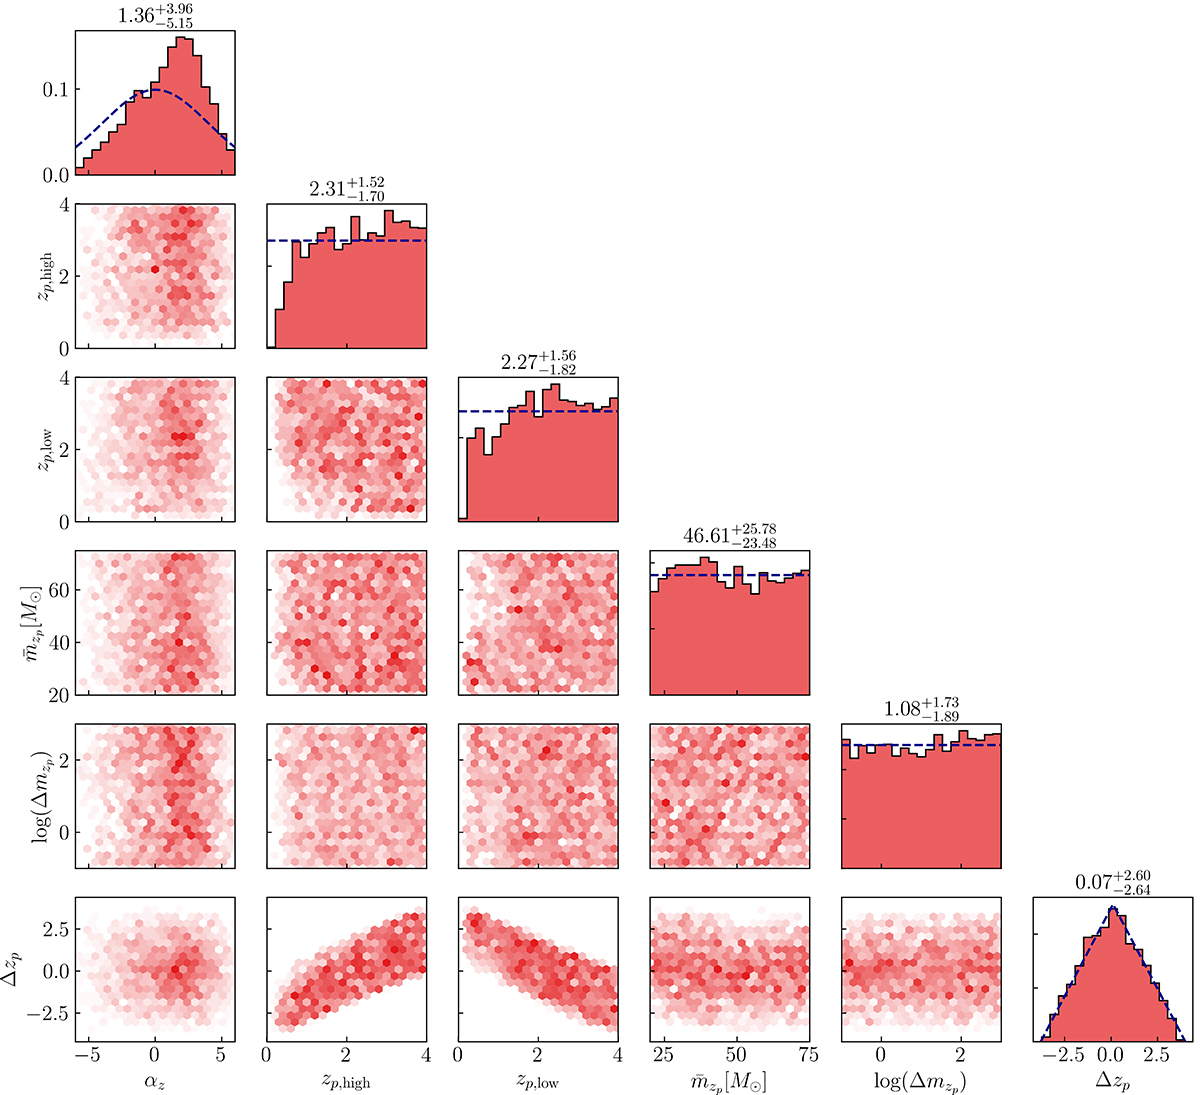
Posterior plots for all hyperparameters connected to the variation in zp in m1 are shown. The dashed lines denote the one-dimensional priors in the one-dimensional plots on top. The two-dimensional posteriors are shown in the corresponding row and column for the hyperparameters. Hyperparameters in this figure include the ascending power-law index αz, the four hyperparameters connected to varying zp via Eq. (2), and the difference between the high- and low-redshift value of zp.
Current usage metrics show cumulative count of Article Views (full-text article views including HTML views, PDF and ePub downloads, according to the available data) and Abstracts Views on Vision4Press platform.
Data correspond to usage on the plateform after 2015. The current usage metrics is available 48-96 hours after online publication and is updated daily on week days.
Initial download of the metrics may take a while.